Hotel competitive analysis explained: how to pick a comp set, score competitors, calculate MPI, ARI and RGI, and run the whole thing without paid tools.





Every hotel already does competitive analysis. A GM checks a rival's rate on Booking.com before approving a weekend price. The owner hears that the property down the road has refurbished. Someone notices a competitor's review score climbed past theirs.
The problem is not that it is not happening. It is that it happens in fragments, nobody writes it down, and the conclusion changes depending on who looked last. A proper analysis turns those scattered observations into one page that tells you whether you are priced correctly for what you actually offer. Here is how to build it.
Hotel competitive analysis is the structured comparison of a property against a defined set of competing hotels across rate, facilities, service quality and online visibility. It produces a view of where the property sits against the market on price and on perceived value, which is then used to set rates, prioritise investment and position the hotel.
Hotel competitive analysis measures your property against a chosen group of competitors and converts the difference into a decision. It is not research for its own sake. If the exercise ends without a rate change, an investment priority or a positioning shift, it was not an analysis.
The output answers one question: are you charging the right price for what a guest actually gets at your property compared with the alternatives they are considering?
Two things commonly get confused with it. Rate shopping is checking competitor prices, which is one input and not the analysis. Market benchmarking compares your performance against aggregate market data, which tells you what happened but not why. Competitive analysis sits between them, explaining the gap your rates and your product create.
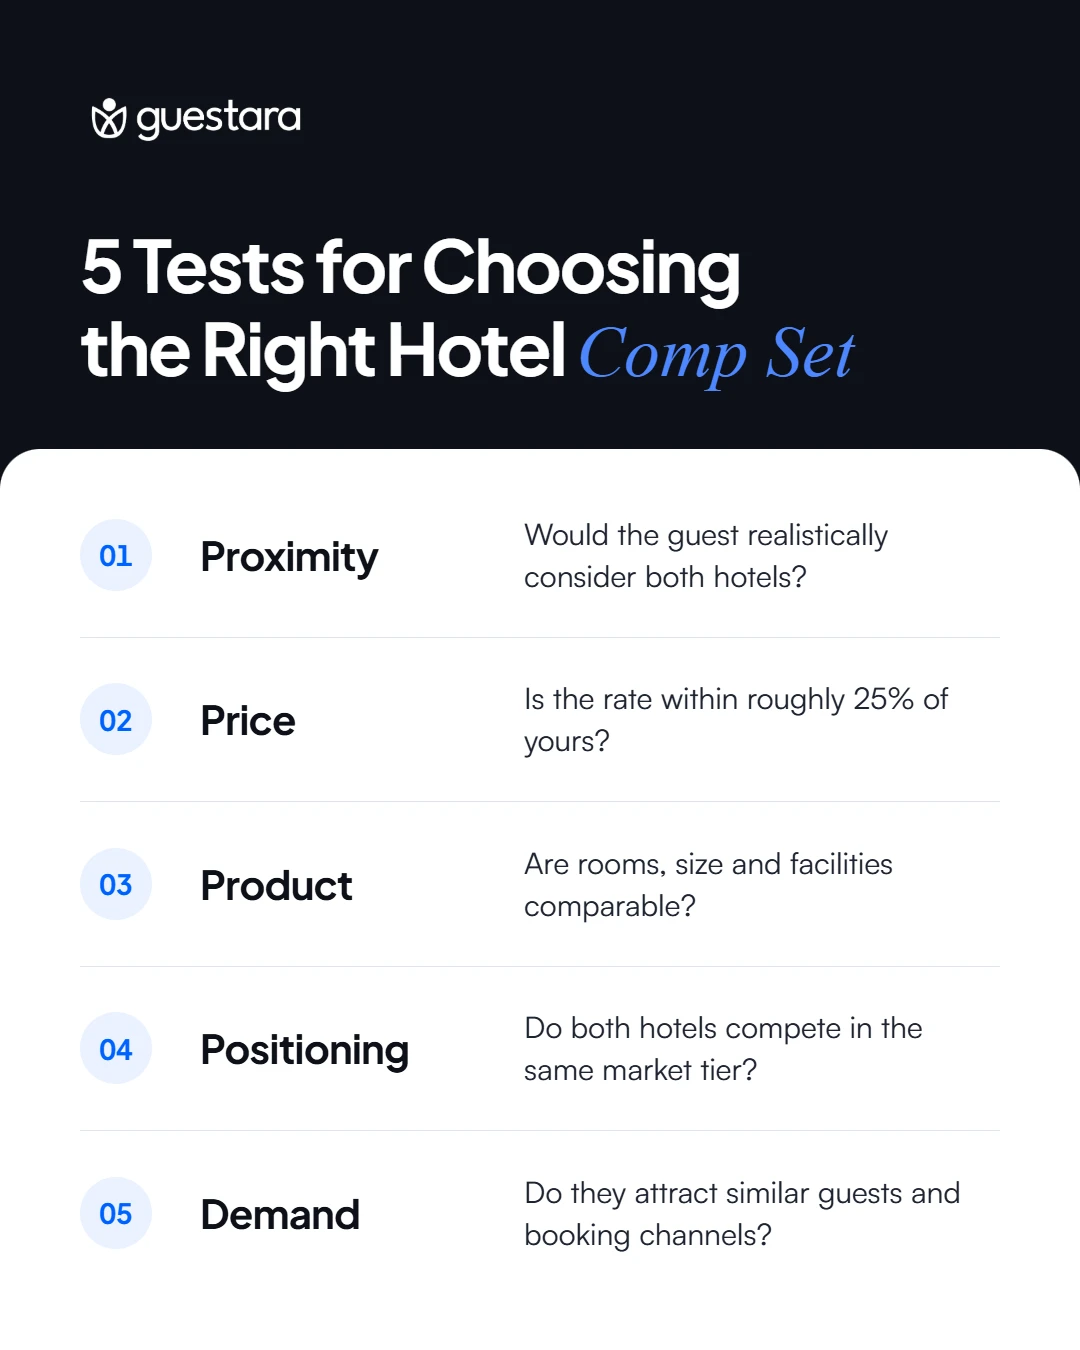
Choose a comp set by selecting properties a guest would genuinely book instead of yours, which is a tighter test than properties that resemble yours. A luxury resort four kilometres away is not a competitor if nobody choosing between the two is the same person.
Five criteria decide membership, and each carries a disqualifier worth applying strictly.
Pick four to six. Below four, a single property distorts the average, and one competitor running a promotion drags your whole comparison with it. Above eight, the set stops describing anything specific and the exercise becomes data collection rather than analysis.
Where a market genuinely holds only two real competitors, use two and say so in the report rather than padding the set with properties nobody is choosing between. A padded comp set produces a comfortable average and a wrong decision.
Some properties need a second set. If you run a city hotel that fills midweek with corporate demand and weekends with leisure, those are two different competitive markets and the same five properties will not describe both.
Compare the dimensions a guest can see before booking plus the performance figures you can observe, because those are what decide the booking and what you can actually verify. Everything else is speculation about a competitor's internals.
Six dimensions carry the analysis, and every one of them can be collected without a subscription.
Record the lowest and the highest public rate, not just the cheapest. The spread tells you how aggressively a competitor yields, and a property with a wide spread is managing rates actively while a flat one is not.
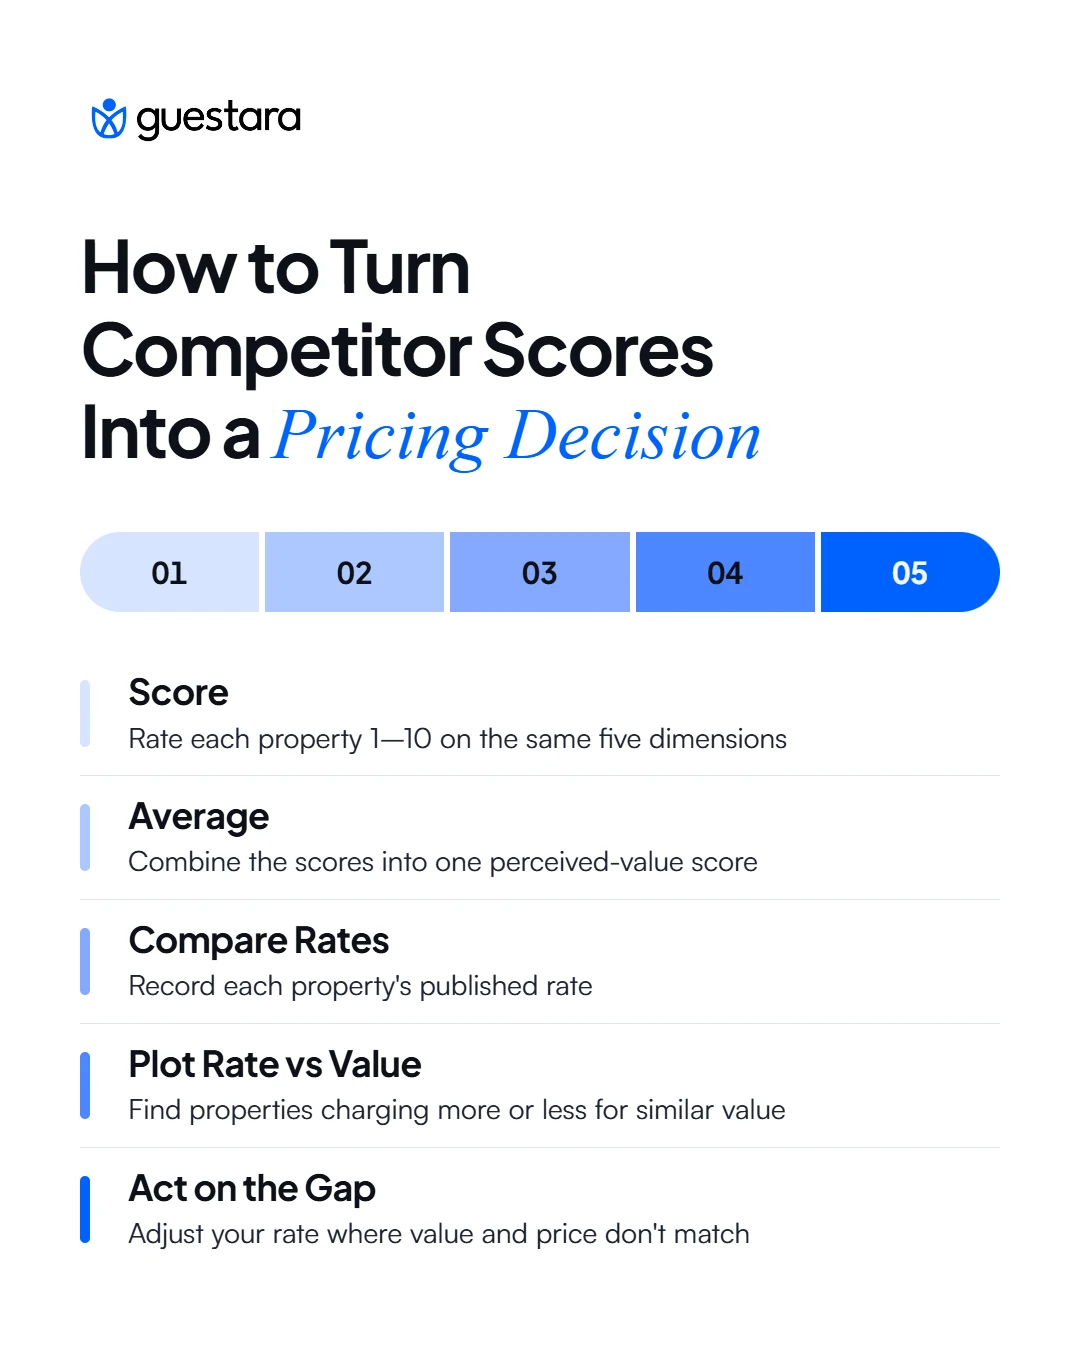
Score each property on the non-price dimensions, average the scores into a single perceived value figure, then plot that against the rate. Where a property sits relative to the diagonal tells you whether it is underpriced or overpriced for what it delivers.
Score each dimension from 1 to 10 against the same definition for every property, including your own. Being honest about your own property is the hard part and the part that decides whether the exercise is worth anything.
Here is a completed comp set for a 42-room city hotel, scoring a standard double for a Tuesday arrival four weeks out.
The arithmetic behind your own 7.4 runs like this. Location scored 8, room product 7, facilities 6, service and reviews 9, visibility 7. That totals 37, and 37 divided by 5 scoring dimensions gives 7.4.
Compare each property's rate to its score and look for the mismatches. Competitor B scores 6.9 and charges 5,900. You score 7.4 and charge 5,400. You deliver more and charge 500 less, which is the clearest finding in the table.
That is a defensible case for moving the Tuesday rate to somewhere between 5,800 and 6,000, testing it across four weeks and watching whether occupancy holds. Competitor C at 4,800 with a 6.2 score is not a reason to drop, because that property is correctly priced for a weaker product.
Run the same table for a Saturday and the ranking often inverts completely. One table describes one date pattern, not the hotel.
Where the scoring table shows how you are positioned, the three benchmarking indices show how that positioning actually performed. Each one divides your result by the comp set result and multiplies by 100, so 100 is parity with the set.
These are the index definitions used in STR and CoStar benchmarking reports, where 100 represents fair share, meaning the property captures exactly the share of business its room count entitles it to.
Worked through the same hotel: occupancy 68% against a comp set at 74% gives an MPI of 92. ADR of 5,400 against a set at 5,000 gives an ARI of 108. RevPAR of 3,672 against a set at 3,700 gives an RGI of 99.
Read the three together, never alone. That property is charging 8% above the market and filling 8% below it, and the two cancel out almost exactly. RGI of 99 looks like parity and conceals a live strategic choice. Whether that choice is right depends on cost per occupied room, which the indices do not see.
Run the whole analysis with a spreadsheet, a private browser window and a fixed weekly slot. Rate shopping tools save time at scale, but nothing in the method requires one, and a property checking five competitors can collect everything it needs in about forty minutes a week.
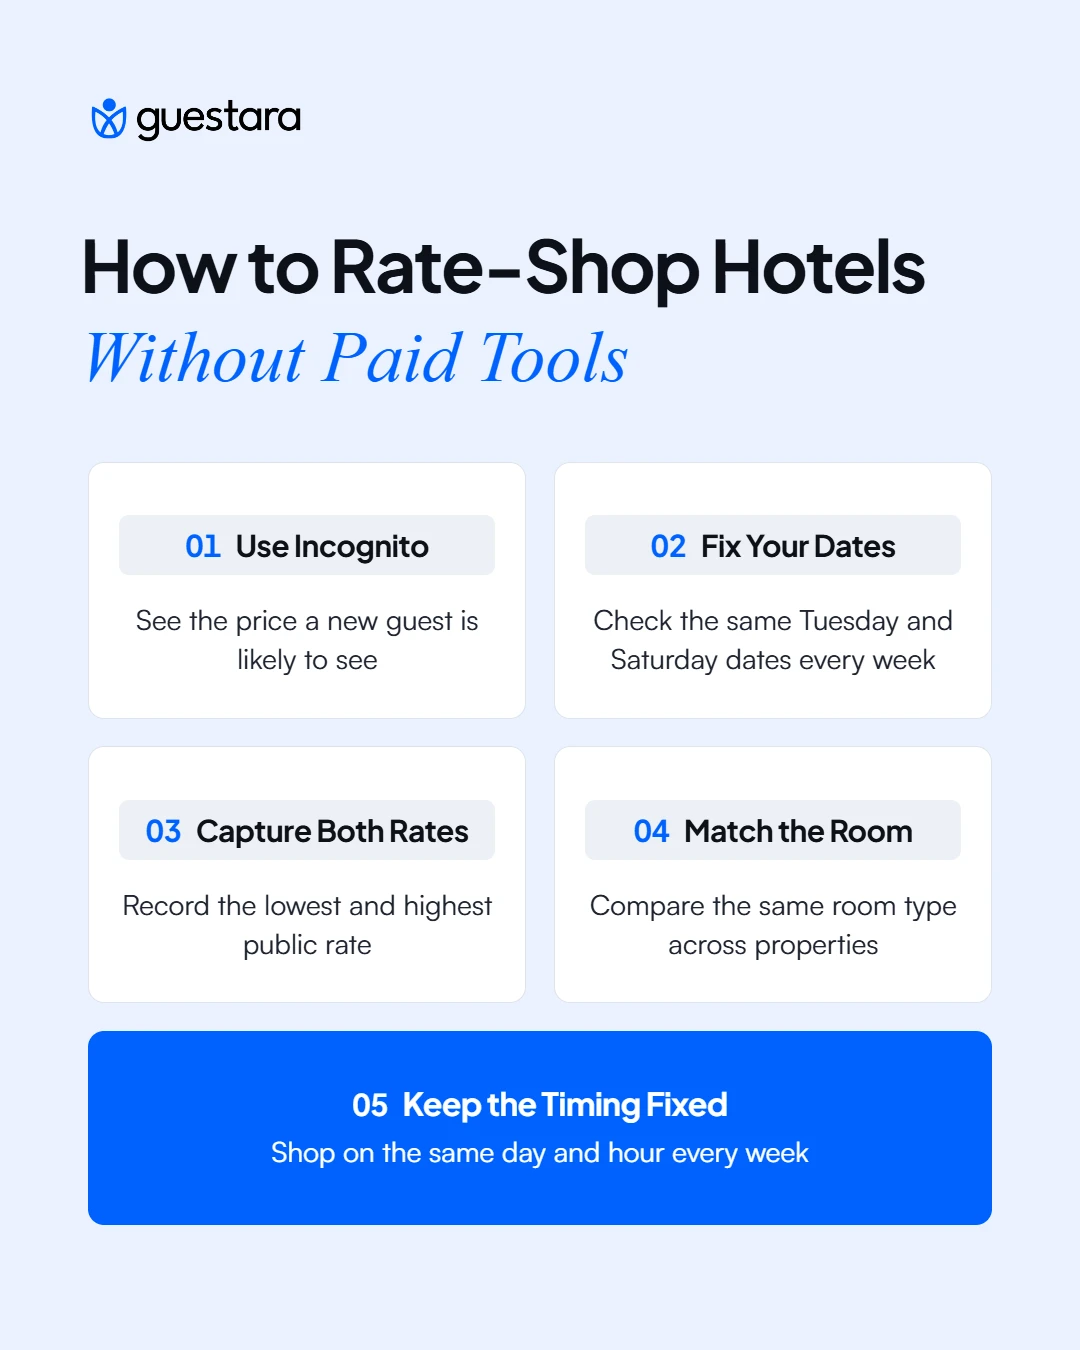
Check the same way every time, because consistency matters more than frequency. Four rules make manual shopping reliable:
One spreadsheet with competitors as rows and dates as columns holds a year of this.
Without a benchmarking subscription you cannot know a competitor's occupancy, but you can observe the signal that matters. Check OTA availability calendars for your comp set on the same schedule and record which dates show limited availability or sell out.
That gives you a demand pattern rather than a number. When four of five competitors show scarcity on the same dates and you have availability, the finding is identical to a low MPI without needing the figure. Treat this as a directional observation, not a calculated occupancy, and never present it as a hard percentage.
A 30-room independent runs a different analysis from a 200-room hotel, and copying the larger property's method is where most small-property attempts fail. The difference is not effort. It is which findings can be acted on.
Three things change. Most of your product dimensions are fixed, so facilities scoring produces findings you cannot act on for years. Your rate moves have a much larger proportional effect, because a 500 change across 30 rooms is a materially different decision from the same change across 200. And a single competitor's promotion distorts your comp set average far more.
So weight the analysis toward what you control this quarter. Service quality, review score, listing completeness, photography and rate are all movable now. Facilities and room size go on a separate list reviewed once a year with the capital plan.
Keep the comp set at four. Score three dimensions rather than six, and do it monthly rather than weekly.
Where most of your business arrives through online travel agencies, the comp set is not the properties you chose. It is the properties appearing beside you in the search results a guest actually sees, and that list is set by the OTA rather than by you.
Run one extra check in that case. Search your own market on the main OTA as a guest would, with your typical dates and filters, and record which properties appear above you. If a property you never considered a competitor sits in position three while you sit in eleven, it is in your comp set whether it resembles your hotel or not.
Visibility competes as hard as price in these markets, and review score is the lever that moves placement fastest. Properties that act on complaints before they become public reviews protect that score, which is what Guestara's Review Collection handles by routing negative feedback to an internal alert while the guest is still on-property.
Redo the parts on three separate clocks rather than repeating the whole exercise. Rates move weekly, positioning moves quarterly, and comp set membership moves annually. Running all three at the same cadence wastes effort on the slow parts and misses the fast ones.
New supply is the trigger most properties miss. A hotel opening within your catchment changes the set immediately, usually opens with introductory pricing that distorts your averages for two quarters, and should be added before its first full month rather than at the next annual review.
Renovation is the second. A competitor that refurbishes has moved up the value axis without necessarily moving its rate yet, and the window before it repositions its pricing is the period where your own rate looks most exposed.
[[cta:cta-5 | eyebrow=Guest Reviews | heading=See how hotels fix problems *before* they reach review sites | btn=Explore Review Management | link=https://www.guestara.com/hospitality-review-management ]]


Hotel competitive analysis explained: how to pick a comp set, score competitors, calculate MPI, ARI and RGI, and run the whole thing without paid tools.
Every hotel already does competitive analysis. A GM checks a rival's rate on Booking.com before approving a weekend price. The owner hears that the property down the road has refurbished. Someone notices a competitor's review score climbed past theirs.
The problem is not that it is not happening. It is that it happens in fragments, nobody writes it down, and the conclusion changes depending on who looked last. A proper analysis turns those scattered observations into one page that tells you whether you are priced correctly for what you actually offer. Here is how to build it.
Hotel competitive analysis is the structured comparison of a property against a defined set of competing hotels across rate, facilities, service quality and online visibility. It produces a view of where the property sits against the market on price and on perceived value, which is then used to set rates, prioritise investment and position the hotel.
Hotel competitive analysis measures your property against a chosen group of competitors and converts the difference into a decision. It is not research for its own sake. If the exercise ends without a rate change, an investment priority or a positioning shift, it was not an analysis.
The output answers one question: are you charging the right price for what a guest actually gets at your property compared with the alternatives they are considering?
Two things commonly get confused with it. Rate shopping is checking competitor prices, which is one input and not the analysis. Market benchmarking compares your performance against aggregate market data, which tells you what happened but not why. Competitive analysis sits between them, explaining the gap your rates and your product create.
Choose a comp set by selecting properties a guest would genuinely book instead of yours, which is a tighter test than properties that resemble yours. A luxury resort four kilometres away is not a competitor if nobody choosing between the two is the same person.
Five criteria decide membership, and each carries a disqualifier worth applying strictly.
Pick four to six. Below four, a single property distorts the average, and one competitor running a promotion drags your whole comparison with it. Above eight, the set stops describing anything specific and the exercise becomes data collection rather than analysis.
Where a market genuinely holds only two real competitors, use two and say so in the report rather than padding the set with properties nobody is choosing between. A padded comp set produces a comfortable average and a wrong decision.
Some properties need a second set. If you run a city hotel that fills midweek with corporate demand and weekends with leisure, those are two different competitive markets and the same five properties will not describe both.
Compare the dimensions a guest can see before booking plus the performance figures you can observe, because those are what decide the booking and what you can actually verify. Everything else is speculation about a competitor's internals.
Six dimensions carry the analysis, and every one of them can be collected without a subscription.
Record the lowest and the highest public rate, not just the cheapest. The spread tells you how aggressively a competitor yields, and a property with a wide spread is managing rates actively while a flat one is not.
Score each property on the non-price dimensions, average the scores into a single perceived value figure, then plot that against the rate. Where a property sits relative to the diagonal tells you whether it is underpriced or overpriced for what it delivers.
Score each dimension from 1 to 10 against the same definition for every property, including your own. Being honest about your own property is the hard part and the part that decides whether the exercise is worth anything.
Here is a completed comp set for a 42-room city hotel, scoring a standard double for a Tuesday arrival four weeks out.
The arithmetic behind your own 7.4 runs like this. Location scored 8, room product 7, facilities 6, service and reviews 9, visibility 7. That totals 37, and 37 divided by 5 scoring dimensions gives 7.4.
Compare each property's rate to its score and look for the mismatches. Competitor B scores 6.9 and charges 5,900. You score 7.4 and charge 5,400. You deliver more and charge 500 less, which is the clearest finding in the table.
That is a defensible case for moving the Tuesday rate to somewhere between 5,800 and 6,000, testing it across four weeks and watching whether occupancy holds. Competitor C at 4,800 with a 6.2 score is not a reason to drop, because that property is correctly priced for a weaker product.
Run the same table for a Saturday and the ranking often inverts completely. One table describes one date pattern, not the hotel.
Where the scoring table shows how you are positioned, the three benchmarking indices show how that positioning actually performed. Each one divides your result by the comp set result and multiplies by 100, so 100 is parity with the set.
These are the index definitions used in STR and CoStar benchmarking reports, where 100 represents fair share, meaning the property captures exactly the share of business its room count entitles it to.
Worked through the same hotel: occupancy 68% against a comp set at 74% gives an MPI of 92. ADR of 5,400 against a set at 5,000 gives an ARI of 108. RevPAR of 3,672 against a set at 3,700 gives an RGI of 99.
Read the three together, never alone. That property is charging 8% above the market and filling 8% below it, and the two cancel out almost exactly. RGI of 99 looks like parity and conceals a live strategic choice. Whether that choice is right depends on cost per occupied room, which the indices do not see.
Run the whole analysis with a spreadsheet, a private browser window and a fixed weekly slot. Rate shopping tools save time at scale, but nothing in the method requires one, and a property checking five competitors can collect everything it needs in about forty minutes a week.
Check the same way every time, because consistency matters more than frequency. Four rules make manual shopping reliable:
One spreadsheet with competitors as rows and dates as columns holds a year of this.
Without a benchmarking subscription you cannot know a competitor's occupancy, but you can observe the signal that matters. Check OTA availability calendars for your comp set on the same schedule and record which dates show limited availability or sell out.
That gives you a demand pattern rather than a number. When four of five competitors show scarcity on the same dates and you have availability, the finding is identical to a low MPI without needing the figure. Treat this as a directional observation, not a calculated occupancy, and never present it as a hard percentage.
A 30-room independent runs a different analysis from a 200-room hotel, and copying the larger property's method is where most small-property attempts fail. The difference is not effort. It is which findings can be acted on.
Three things change. Most of your product dimensions are fixed, so facilities scoring produces findings you cannot act on for years. Your rate moves have a much larger proportional effect, because a 500 change across 30 rooms is a materially different decision from the same change across 200. And a single competitor's promotion distorts your comp set average far more.
So weight the analysis toward what you control this quarter. Service quality, review score, listing completeness, photography and rate are all movable now. Facilities and room size go on a separate list reviewed once a year with the capital plan.
Keep the comp set at four. Score three dimensions rather than six, and do it monthly rather than weekly.
Where most of your business arrives through online travel agencies, the comp set is not the properties you chose. It is the properties appearing beside you in the search results a guest actually sees, and that list is set by the OTA rather than by you.
Run one extra check in that case. Search your own market on the main OTA as a guest would, with your typical dates and filters, and record which properties appear above you. If a property you never considered a competitor sits in position three while you sit in eleven, it is in your comp set whether it resembles your hotel or not.
Visibility competes as hard as price in these markets, and review score is the lever that moves placement fastest. Properties that act on complaints before they become public reviews protect that score, which is what Guestara's Review Collection handles by routing negative feedback to an internal alert while the guest is still on-property.
Redo the parts on three separate clocks rather than repeating the whole exercise. Rates move weekly, positioning moves quarterly, and comp set membership moves annually. Running all three at the same cadence wastes effort on the slow parts and misses the fast ones.
New supply is the trigger most properties miss. A hotel opening within your catchment changes the set immediately, usually opens with introductory pricing that distorts your averages for two quarters, and should be added before its first full month rather than at the next annual review.
Renovation is the second. A competitor that refurbishes has moved up the value axis without necessarily moving its rate yet, and the window before it repositions its pricing is the period where your own rate looks most exposed.
[[cta:cta-5 | eyebrow=Guest Reviews | heading=See how hotels fix problems *before* they reach review sites | btn=Explore Review Management | link=https://www.guestara.com/hospitality-review-management ]]
A comp set, short for competitive set, is the defined group of hotels a property measures itself against. Membership is decided by whether a guest would genuinely book that property instead of yours, using proximity, price band, product, positioning and demand source. Most hotels use four to six properties, and benchmarking reports calculate performance indices against this set rather than against the whole market.
Four to six works for most properties. Below four, a single competitor's promotion distorts the average enough to produce a wrong conclusion. Above eight, the set stops describing a specific competitive position. Where a market genuinely holds only two real competitors, use two and note the limitation rather than padding the set.
Rate shopping records what competitors are charging on given dates. Competitive analysis takes those rates and sets them against what each property actually offers, producing a view of whether your price matches your value. Rate shopping is one input, usually the easiest one to collect, and on its own it tells you nothing about whether a price difference is justified.
MPI is your occupancy divided by your comp set's occupancy, multiplied by 100. ARI uses ADR in the same formula and RGI uses RevPAR. A result of 100 means parity with the comp set, above 100 means you capture more than your fair share on that metric, and below 100 means less. Read all three together, since a high rate index and a low occupancy index can offset into a misleadingly neutral RGI.
Yes. The full method runs on a spreadsheet using OTA listings, competitor websites and public review pages, and a property tracking five competitors can collect what it needs in under an hour a week. Shop rates in a private browser window on fixed dates and a fixed weekday, because consistency matters more than volume. Paid tools save time at scale rather than enabling anything the manual method cannot do.
We work closely with the industry leaders to offer seamless solutions




We’re here to help your whole team stay ahead of the curve as you grow.

Get up and running quickly with a personalized onboarding plan

Connect with real people who really get it, 24/7

Checkout our vast library of free resources, templates and more
There's only so much we can say — so let us show you! Schedule a demo today and reach your business goals.