Learn which guest journey KPIs actually matter from booking confirmation open rates to upsell timing, FAQ deflection, and front desk call reduction.
.webp)
Most hotels track the wrong numbers.
RevPAR, ADR, occupancy — these tell you how your rooms are selling. They do not tell you anything about why a guest chose not to come back, why your review scores plateaued, or why your front desk gets 40 calls a day asking for the WiFi password.
The guest journey has its own set of metrics. And if you are not tracking them, you are managing the experience blind.
This guide breaks down the KPIs that actually measure what is happening at each stage of the guest journey — from the moment a booking is confirmed to the week after checkout — and what each number tells you about where your experience is breaking down.
Guest journey KPIs are metrics that measure how guests experience your property at each stage of their stay — before arrival, during their time on property, and after checkout.
They are different from standard hotel performance metrics in a fundamental way.
RevPAR tells you how much revenue a room generated. A guest journey KPI tells you whether the guest who stayed in that room felt welcomed before they arrived, got their questions answered quickly during the stay, and had a reason to come back.
Standard metrics measure business outcomes. Guest journey KPIs measure the causes of those outcomes.
Here is how they connect in practice:
Every one of these is measurable. Most hotels are tracking none of them.
The guest journey KPI framework used in this blog maps metrics to five phases: pre-booking, pre-arrival, in-stay, checkout, and post-stay. Each phase has its own indicators. Together, they give you a complete picture of the guest experience — not just the financial outcome.
The guest journey starts before the guest books. The metrics that matter here are about how well you are setting expectations and how effectively you are capturing intent.
What it measures: Whether guests are actually reading the information you send them after booking.
Why it matters: A booking confirmation email that goes unopened means the guest is arriving without access to your pre-arrival instructions, check-in details, or early upsell opportunities. Everything downstream gets harder.
Benchmark to aim for: Hotel booking confirmation emails see open rates above 60% when sent immediately after booking, according to Revinate's 2024 Hospitality Benchmark Report. Marketing emails average 35.8% for North American properties. If your confirmation is below 50%, look at subject line clarity and send timing first.
How to act on it:
What it measures: The percentage of reservations made through your own channels versus OTAs.
Why it matters: A high OTA dependency means you are paying commission on guests you could have acquired directly — and you have less data and less communication access for those guests. Understanding the complete hotel guest communication journey starts with knowing which guests you actually own a relationship with.
One often-overlooked reason direct booking rates stall has nothing to do with pricing or visibility — it is the booking flow itself. Research on hotel website user journeys shows that around 40% of users abandon a site that loads too slowly, and more than 50% abandon a booking flow that drags beyond three steps. Guests who want to book direct are losing patience before they complete the reservation. That is a measurable, fixable conversion problem — not a demand problem.
Benchmark to aim for: Industry average direct booking rates sit around 20-30% for independent hotels. Properties running active direct booking programs and messaging-based retargeting report rates of 40-50%.
How to act on it:
The pre-arrival phase — from booking confirmation to day of arrival — is where most hotels either set themselves up for a smooth stay or create the friction that causes problems later.
What it measures: Whether guests are reading your pre-arrival communications — check-in instructions, upsell offers, FAQ links, digital key setup.
Why it matters: Guests who read your pre-arrival messaging arrive more prepared. They have already completed digital check-in. They know where to park. They have seen the upsell offer. They are not queuing at the front desk asking questions your message already answered.
Benchmark to aim for: Pre-arrival WhatsApp messages sent 24-48 hours before check-in achieve read rates above 80% for opted-in contacts. Email pre-arrivals average 35-45% open rates in hospitality.
How to act on it:
What it measures: The percentage of guests who complete check-in digitally before arriving at the property.
Why it matters: Every guest who checks in digitally removes one interaction from the front desk queue. That frees your team for higher-value conversations. It also signals that the guest received and engaged with your pre-arrival communication.
The demand is there. Research into the digital guest journey shows that 73% of travelers prefer hotels that offer self-service technology — including digital check-in, mobile keys, and self-service portals. If your digital check-in adoption rate is low, the problem is not guest willingness. It is how prominently you are offering it and how easy you are making it to find.
Benchmark to aim for: Properties using active pre-arrival messaging to promote digital check-in report adoption rates of 40-60%. Properties that bury the link in a long email report 10-15%.
How to act on it:
What it measures: How many guests who received a pre-arrival upsell message clicked through to learn more or purchase.
Why it matters: Pre-arrival is the highest-converting window for upsell offers guests are in planning mode, their excitement about the trip is fresh, and the decision to upgrade or add an experience feels natural rather than transactional.
Benchmark to aim for: Properties using messaging-based upsells are seeing a lift in ancillary revenue of 10–15% on average, with pre-arrival timing consistently outperforming in-stay or at-checkout offers.
How to act on it:

The in-stay phase is where the guest experience actually happens. The KPIs here measure how well your team is responding, how often guests need to escalate, and how effectively your communication is reducing friction.
What it measures: How long it takes your team to respond to a guest message during the stay.
Why it matters: Response time is one of the strongest predictors of guest satisfaction scores. Response times improve by 60% with messaging versus phone calls, but only when the incoming messages are being managed through a system that routes them efficiently.
The channel preference shift makes this KPI more urgent than it was even two years ago.
A 2026 overview of guest messaging trends reports that texting is now the most preferred communication method while traveling — across all generations, including Gen X and Baby Boomers, not just Gen Z and Millennials. This is no longer a preference held by younger guests. It is a baseline expectation across your entire guest base. Slow response times on messaging channels affect a far wider share of your guests than most hotel teams realize.
Benchmark to aim for: Industry standard for in-stay message response is under 5 minutes for urgent requests and under 15 minutes for general inquiries. Properties with an unmanaged or split-channel inbox average 45-90 minutes.
How to act on it:
What it measures: How many of your daily front desk calls are questions that could have been answered through messaging, digital guidebooks, or FAQ automation.
Why it matters: Every call asking "What is the WiFi password?" or "What time does the pool close?" is a call that pulled your team away from a guest standing in front of them. Tracking the type of calls — not just the volume — tells you exactly which information gaps to close. Leading guest messaging platforms now include AI-powered agents capable of handling 70–90% of routine inquiries without human intervention.
Benchmark to aim for: Properties using FAQ automation and digital guidebooks report reductions in routine inquiry calls of 30-50% within the first 60 days. Marriott's chatbot reduced front-desk calls by 35%.
How to act on it:
What it measures: The percentage of routine guest questions answered automatically through chatbot, auto-reply, or digital guidebook — without requiring staff intervention.
Why it matters: High deflection means your automation is doing its job. Low deflection means either the automation is not surfacing the right answers, the content is outdated, or guests are not being directed to it.
Benchmark to aim for: A well-configured FAQ automation setup should deflect 60-70% of routine inquiries. Below 40% usually means the guidebook content needs updating or the entry points (welcome message, chatbot prompt) are not prominent enough.
How to act on it:
Checkout is a brief but high-stakes phase. The guest's final in-person impression is forming here. The KPIs in this phase measure how smooth the exit is and how effectively you capture satisfaction data before the guest leaves.
What it measures: The percentage of guests using digital or express checkout versus queuing at the front desk.
Why it matters: A long checkout queue on departure morning is one of the most common reasons a genuinely positive stay gets a 4-star review instead of 5. The last 15 minutes have a disproportionate impact on the final impression.
Benchmark to aim for: Properties that promote express checkout via in-stay messaging the night before departure report adoption rates of 30-50%. Properties that do not promote it report under 10%.
How to act on it:
What it measures: Whether guests are responding to your mid-stay check-in messages, and what their responses indicate about the current stay quality.
Why it matters: A mid-stay check-in message — something as simple as "How is everything going?" — gives you a real-time signal about service quality while there is still time to fix it. Guests who report a problem mid-stay and have it resolved are significantly more likely to leave a positive review than guests who report the same problem post-checkout.
Benchmark to aim for: Mid-stay check-in response rates via WhatsApp average 30-40%. Via SMS, 20-30%. Below 15% usually means the message is arriving at the wrong time (mealtimes, early morning) or feels too formal.
How to act on it:
Post-stay KPIs measure whether your engagement after checkout is converting experience into revenue. These metrics tie directly to the post-stay guest engagement strategy that bridges guest satisfaction to repeat bookings.
What it measures: The percentage of guests who received a review request and actually wrote a review.
Why it matters: This is the direct output of your post-stay communication quality. A high conversion rate means the timing was right, the channel was right, and the stay gave the guest something worth saying.
Benchmark to aim for: Review request conversion rates average 15-25% for well-timed, single-channel requests. Multi-channel campaigns (WhatsApp + email) can reach 30-35%.
How to act on it:
What it measures: The percentage of guests who complete your private post-stay feedback survey.
Why it matters: Survey data is your most actionable operational intelligence. It tells you what the reviews do not — the specific friction points, the service failures that were quietly endured rather than publicly posted, and the details that your team can actually fix.
Benchmark to aim for: Post-stay survey completion rates average 20-30%. Below 10% means the survey is too long, arriving too late, or being sent on a channel the guest has already disengaged from.
How to act on it:
What it measures: The percentage of guests who returned to book again within 12 months, specifically from the cohort that received your post-stay engagement sequence.
Why it matters: This is the metric that connects every other KPI in this framework to revenue. A high repeat booking rate tells you the entire guest journey is working — not just the post-stay phase.
Benchmark to aim for: Industry average repeat booking rates sit around 15-20% for leisure properties without structured post-stay engagement. Properties with active post-stay messaging programs report 25-35%.
How to act on it:
Beyond the phase-by-phase framework, there is a layer of messaging-specific KPIs that most hotels never track — and should.
These metrics live at the intersection of guest communication and operational performance. They are the leading indicators that predict how the experience metrics will look before the reviews come in.
Messages per stay Track how many messages your team sends and receives per guest stay. A rising number over time — without a corresponding improvement in satisfaction — suggests your automated FAQs and digital guidebooks are not doing their job. Guests are still messaging for information they should be finding on their own.
Channel consistency rate What percentage of guest conversations start and end on the same channel? Guests who begin on WhatsApp and get redirected to email mid-conversation report lower satisfaction. Track handoffs and minimize unnecessary channel switching.
Upsell message response rate by timing If you send the same upsell offer at different times — 5 days before arrival, 2 days before, and on arrival day — the response rates will vary significantly. Track by timing, not just by offer type. The insight is usually in the timing, not the offer itself.
Escalation rate What percentage of automated FAQ responses get escalated to a human team member? A high escalation rate on a specific topic tells you the automation is not answering that question well. A low escalation rate across the board tells you the automation is healthy.
Tracking these metrics is only useful if they are visible to the people who can act on them.
A practical guest journey KPI dashboard for a hotel team does not need to be complex. It needs to be reviewed regularly and connected to decisions.
Here is a simple structure that works:
Daily view (front desk and duty manager)
Weekly view (operations manager)
Monthly view (general manager)
The goal is not to track everything. It is to track the metrics that tell you something you can act on. Most hotels that fail at KPI tracking fail because they generate reports but do not build a process for responding to what those reports show.
A property can hit its RevPAR target and still be losing guests.
That happens when the revenue numbers look healthy but the experience metrics are quietly declining — review scores edging down, repeat booking rate flat, upsell revenue stagnant despite high occupancy.
Guest journey KPIs are early warning signals. They show you where the experience is breaking before the revenue impact becomes visible.
A drop in pre-arrival message open rate tells you guests are arriving less prepared — which predicts more front desk friction. A rise in average message response time tells you your team is overwhelmed — which predicts lower in-stay satisfaction scores. A falling upsell click-through rate tells you either the offer timing is wrong or the offer is not relevant — which predicts flat ancillary revenue.
These connections are not theoretical. AI-powered upsell systems achieve 31% conversion versus 12% for manual upsell approaches, and the difference is almost entirely in timing and relevance — exactly what journey-phase KPIs help you optimize.
The hotels that manage by these metrics are able to intervene early. They catch the problem in the pre-arrival phase before it becomes a front desk complaint. They see the upsell conversion drop in week one of a new campaign before they have run it for a month on a losing approach.
Managing the guest journey by KPIs means managing by cause rather than consequence.
Most hotel teams want to track these metrics. The barrier is not intent — it is having a system that surfaces them without requiring manual data collection across five different tools.
Guestara's analytics dashboard connects messaging activity, guest communication data, and journey automation into one view. You can see response times, upsell conversion rates, digital check-in adoption, and post-stay engagement metrics without pulling reports from separate systems.
When your hotel guest communication operates from a single platform, the KPIs emerge naturally from what your team is already doing. You are not creating extra work to track performance — you are making the work you are already doing visible.
If you want to see what guest journey metrics look like for a property using Guestara, book a demo with the team.


Learn which guest journey KPIs actually matter from booking confirmation open rates to upsell timing, FAQ deflection, and front desk call reduction.
Most hotels track the wrong numbers.
RevPAR, ADR, occupancy — these tell you how your rooms are selling. They do not tell you anything about why a guest chose not to come back, why your review scores plateaued, or why your front desk gets 40 calls a day asking for the WiFi password.
The guest journey has its own set of metrics. And if you are not tracking them, you are managing the experience blind.
This guide breaks down the KPIs that actually measure what is happening at each stage of the guest journey — from the moment a booking is confirmed to the week after checkout — and what each number tells you about where your experience is breaking down.
Guest journey KPIs are metrics that measure how guests experience your property at each stage of their stay — before arrival, during their time on property, and after checkout.
They are different from standard hotel performance metrics in a fundamental way.
RevPAR tells you how much revenue a room generated. A guest journey KPI tells you whether the guest who stayed in that room felt welcomed before they arrived, got their questions answered quickly during the stay, and had a reason to come back.
Standard metrics measure business outcomes. Guest journey KPIs measure the causes of those outcomes.
Here is how they connect in practice:
Every one of these is measurable. Most hotels are tracking none of them.
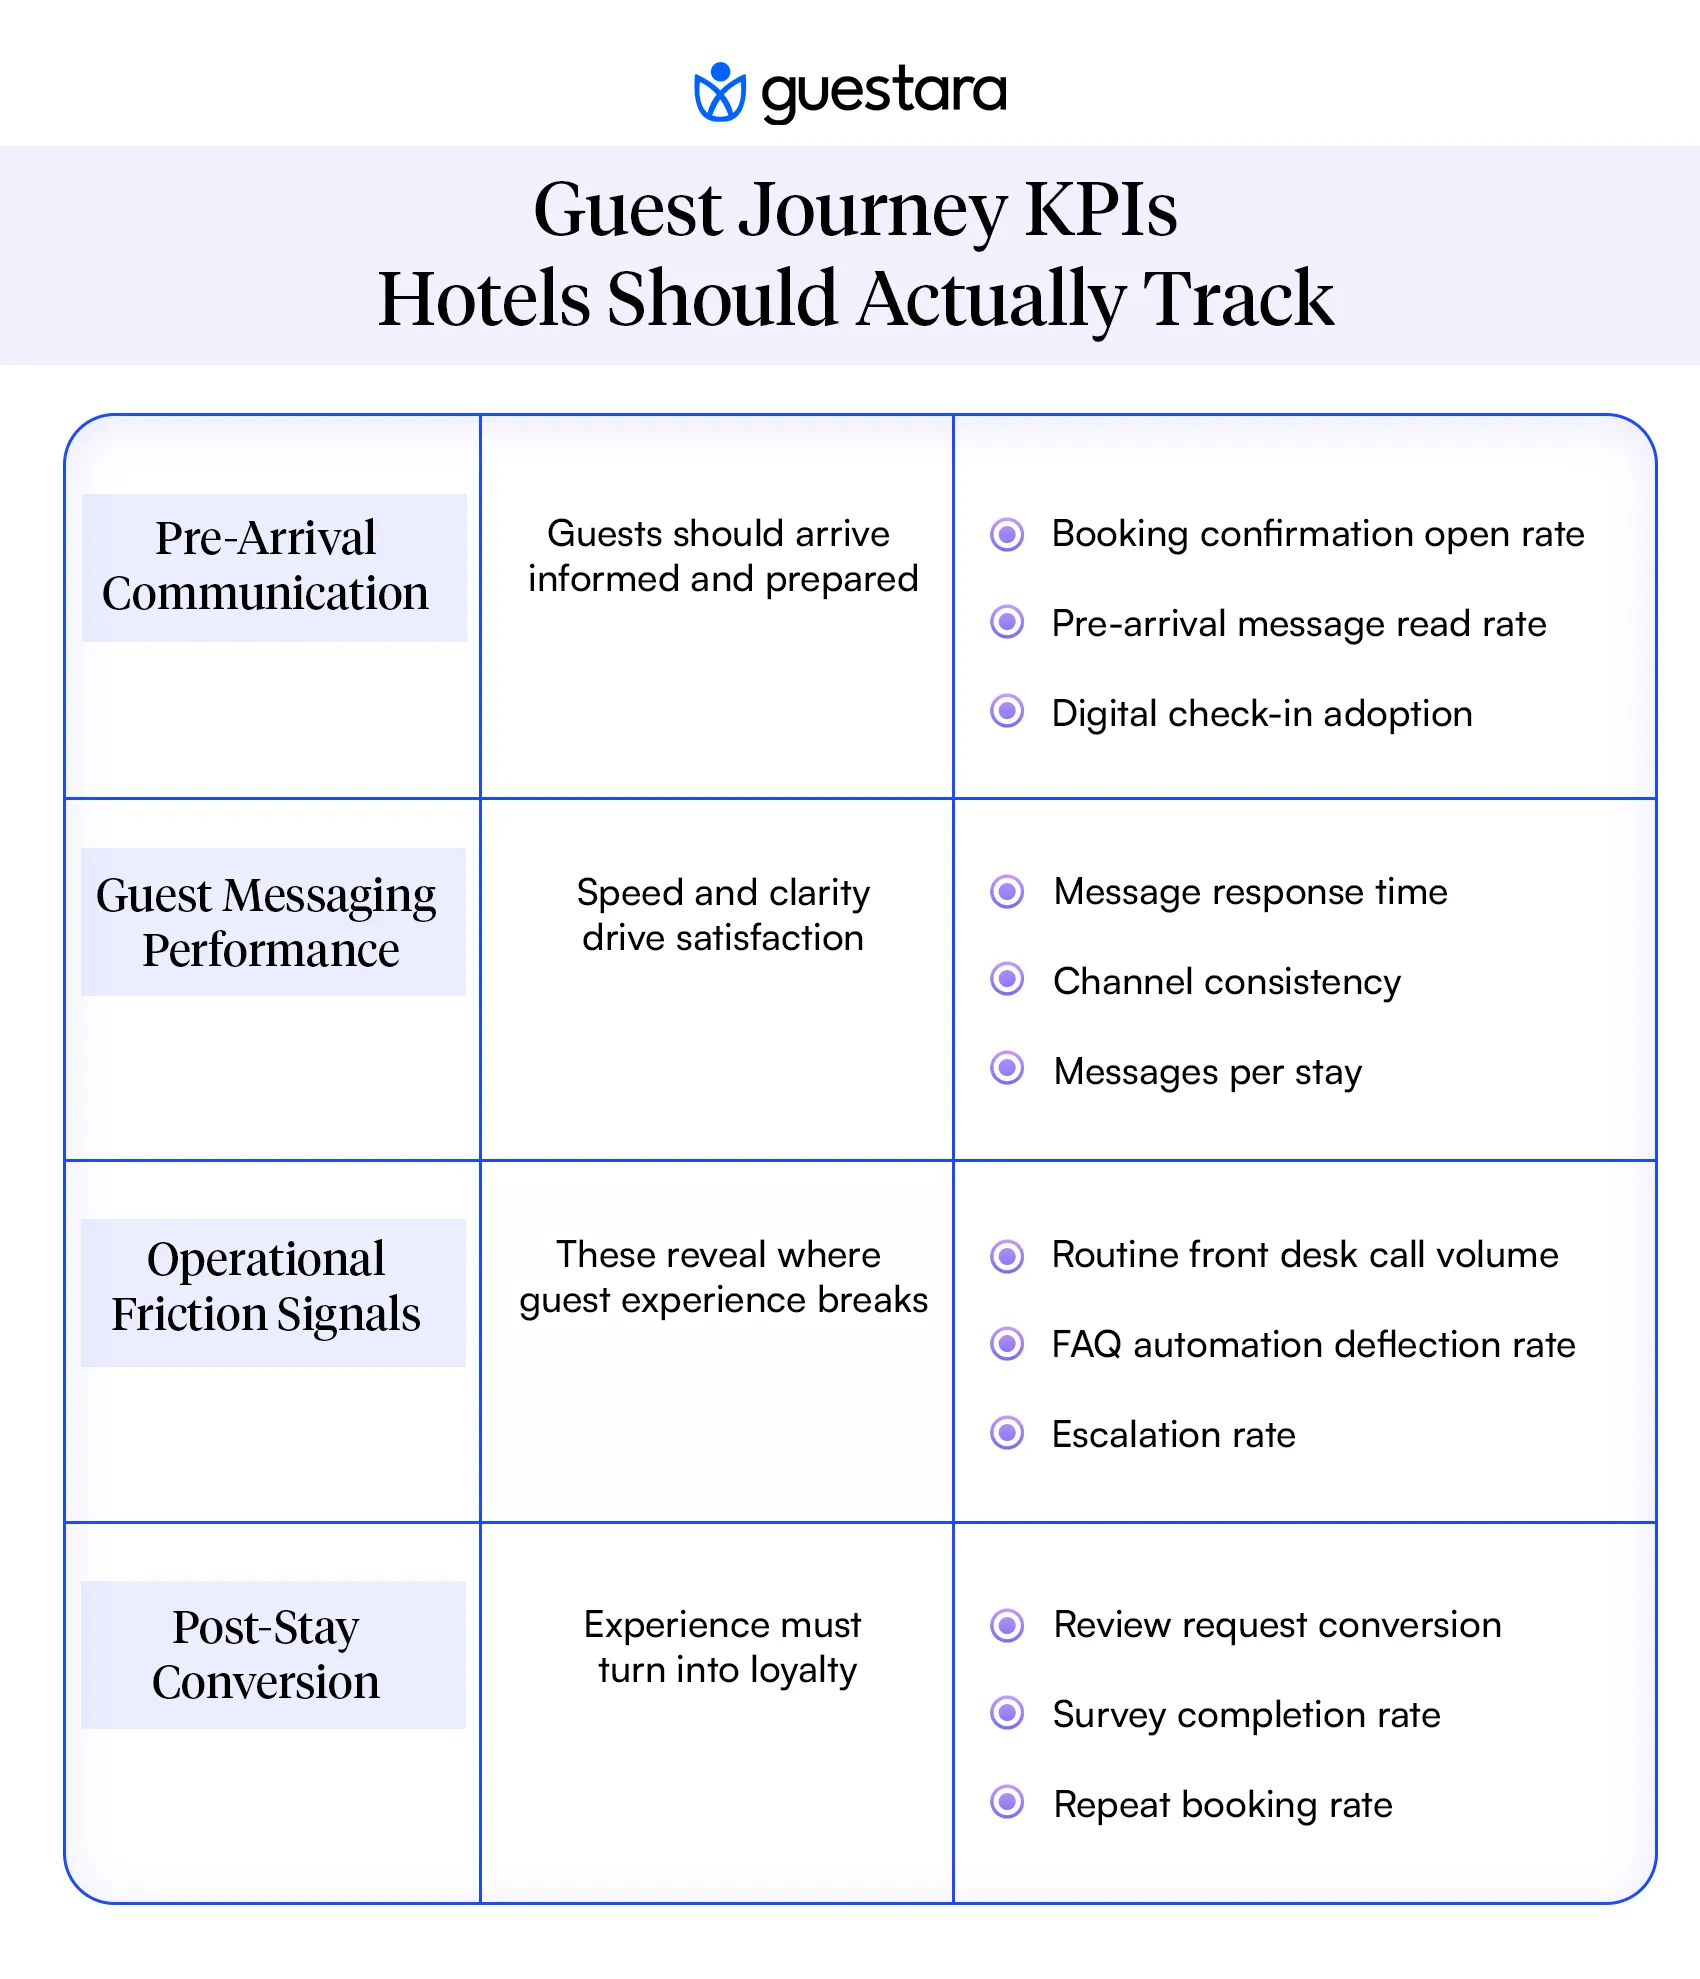
The guest journey KPI framework used in this blog maps metrics to five phases: pre-booking, pre-arrival, in-stay, checkout, and post-stay. Each phase has its own indicators. Together, they give you a complete picture of the guest experience — not just the financial outcome.
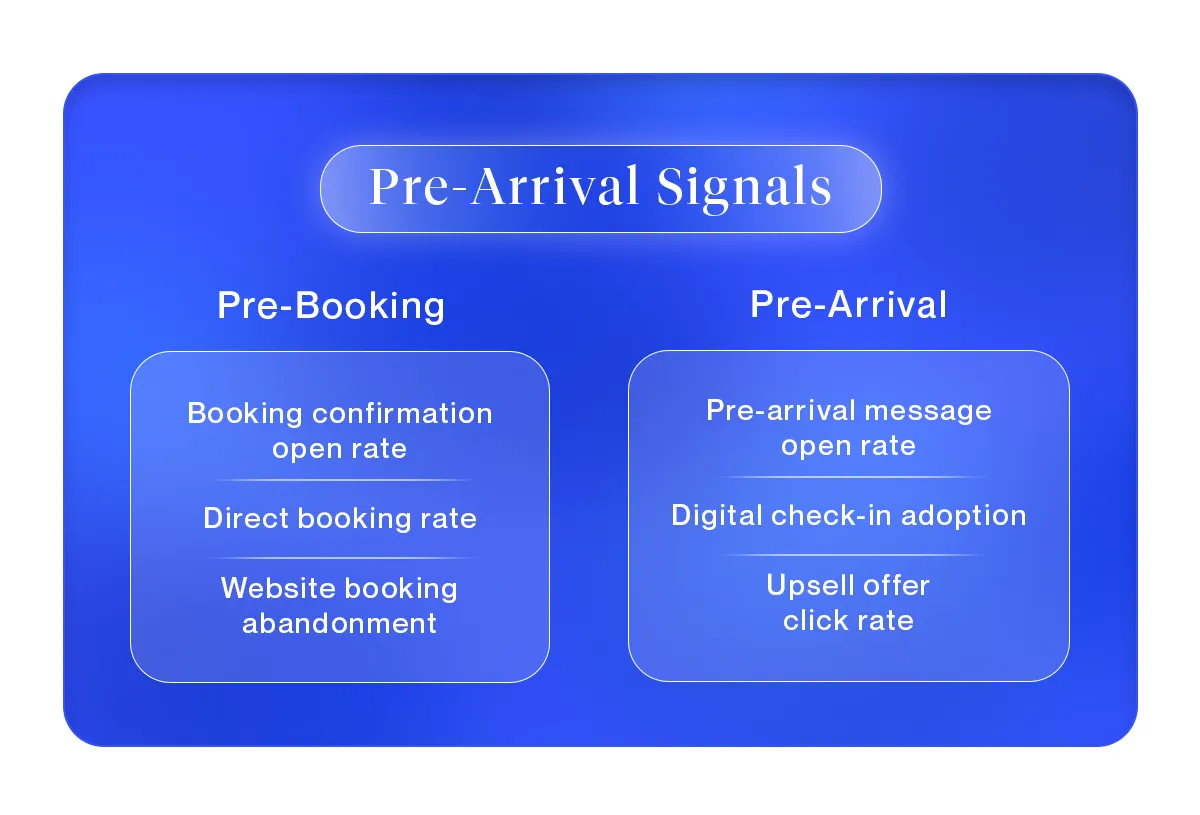
The guest journey starts before the guest books. The metrics that matter here are about how well you are setting expectations and how effectively you are capturing intent.
What it measures: Whether guests are actually reading the information you send them after booking.
Why it matters: A booking confirmation email that goes unopened means the guest is arriving without access to your pre-arrival instructions, check-in details, or early upsell opportunities. Everything downstream gets harder.
Benchmark to aim for: Hotel booking confirmation emails see open rates above 60% when sent immediately after booking, according to Revinate's 2024 Hospitality Benchmark Report. Marketing emails average 35.8% for North American properties. If your confirmation is below 50%, look at subject line clarity and send timing first.
How to act on it:
What it measures: The percentage of reservations made through your own channels versus OTAs.
Why it matters: A high OTA dependency means you are paying commission on guests you could have acquired directly — and you have less data and less communication access for those guests. Understanding the complete hotel guest communication journey starts with knowing which guests you actually own a relationship with.
One often-overlooked reason direct booking rates stall has nothing to do with pricing or visibility — it is the booking flow itself. Research on hotel website user journeys shows that around 40% of users abandon a site that loads too slowly, and more than 50% abandon a booking flow that drags beyond three steps. Guests who want to book direct are losing patience before they complete the reservation. That is a measurable, fixable conversion problem — not a demand problem.
Benchmark to aim for: Industry average direct booking rates sit around 20-30% for independent hotels. Properties running active direct booking programs and messaging-based retargeting report rates of 40-50%.
How to act on it:
The pre-arrival phase — from booking confirmation to day of arrival — is where most hotels either set themselves up for a smooth stay or create the friction that causes problems later.
What it measures: Whether guests are reading your pre-arrival communications — check-in instructions, upsell offers, FAQ links, digital key setup.
Why it matters: Guests who read your pre-arrival messaging arrive more prepared. They have already completed digital check-in. They know where to park. They have seen the upsell offer. They are not queuing at the front desk asking questions your message already answered.
Benchmark to aim for: Pre-arrival WhatsApp messages sent 24-48 hours before check-in achieve read rates above 80% for opted-in contacts. Email pre-arrivals average 35-45% open rates in hospitality.
How to act on it:
What it measures: The percentage of guests who complete check-in digitally before arriving at the property.
Why it matters: Every guest who checks in digitally removes one interaction from the front desk queue. That frees your team for higher-value conversations. It also signals that the guest received and engaged with your pre-arrival communication.
The demand is there. Research into the digital guest journey shows that 73% of travelers prefer hotels that offer self-service technology — including digital check-in, mobile keys, and self-service portals. If your digital check-in adoption rate is low, the problem is not guest willingness. It is how prominently you are offering it and how easy you are making it to find.
Benchmark to aim for: Properties using active pre-arrival messaging to promote digital check-in report adoption rates of 40-60%. Properties that bury the link in a long email report 10-15%.
How to act on it:
What it measures: How many guests who received a pre-arrival upsell message clicked through to learn more or purchase.
Why it matters: Pre-arrival is the highest-converting window for upsell offers guests are in planning mode, their excitement about the trip is fresh, and the decision to upgrade or add an experience feels natural rather than transactional.
Benchmark to aim for: Properties using messaging-based upsells are seeing a lift in ancillary revenue of 10–15% on average, with pre-arrival timing consistently outperforming in-stay or at-checkout offers.
How to act on it:
The in-stay phase is where the guest experience actually happens. The KPIs here measure how well your team is responding, how often guests need to escalate, and how effectively your communication is reducing friction.
What it measures: How long it takes your team to respond to a guest message during the stay.
Why it matters: Response time is one of the strongest predictors of guest satisfaction scores. Response times improve by 60% with messaging versus phone calls, but only when the incoming messages are being managed through a system that routes them efficiently.
The channel preference shift makes this KPI more urgent than it was even two years ago.
A 2026 overview of guest messaging trends reports that texting is now the most preferred communication method while traveling — across all generations, including Gen X and Baby Boomers, not just Gen Z and Millennials. This is no longer a preference held by younger guests. It is a baseline expectation across your entire guest base. Slow response times on messaging channels affect a far wider share of your guests than most hotel teams realize.
Benchmark to aim for: Industry standard for in-stay message response is under 5 minutes for urgent requests and under 15 minutes for general inquiries. Properties with an unmanaged or split-channel inbox average 45-90 minutes.
How to act on it:
What it measures: How many of your daily front desk calls are questions that could have been answered through messaging, digital guidebooks, or FAQ automation.
Why it matters: Every call asking "What is the WiFi password?" or "What time does the pool close?" is a call that pulled your team away from a guest standing in front of them. Tracking the type of calls — not just the volume — tells you exactly which information gaps to close. Leading guest messaging platforms now include AI-powered agents capable of handling 70–90% of routine inquiries without human intervention.
Benchmark to aim for: Properties using FAQ automation and digital guidebooks report reductions in routine inquiry calls of 30-50% within the first 60 days. Marriott's chatbot reduced front-desk calls by 35%.
How to act on it:
What it measures: The percentage of routine guest questions answered automatically through chatbot, auto-reply, or digital guidebook — without requiring staff intervention.
Why it matters: High deflection means your automation is doing its job. Low deflection means either the automation is not surfacing the right answers, the content is outdated, or guests are not being directed to it.
Benchmark to aim for: A well-configured FAQ automation setup should deflect 60-70% of routine inquiries. Below 40% usually means the guidebook content needs updating or the entry points (welcome message, chatbot prompt) are not prominent enough.
How to act on it:
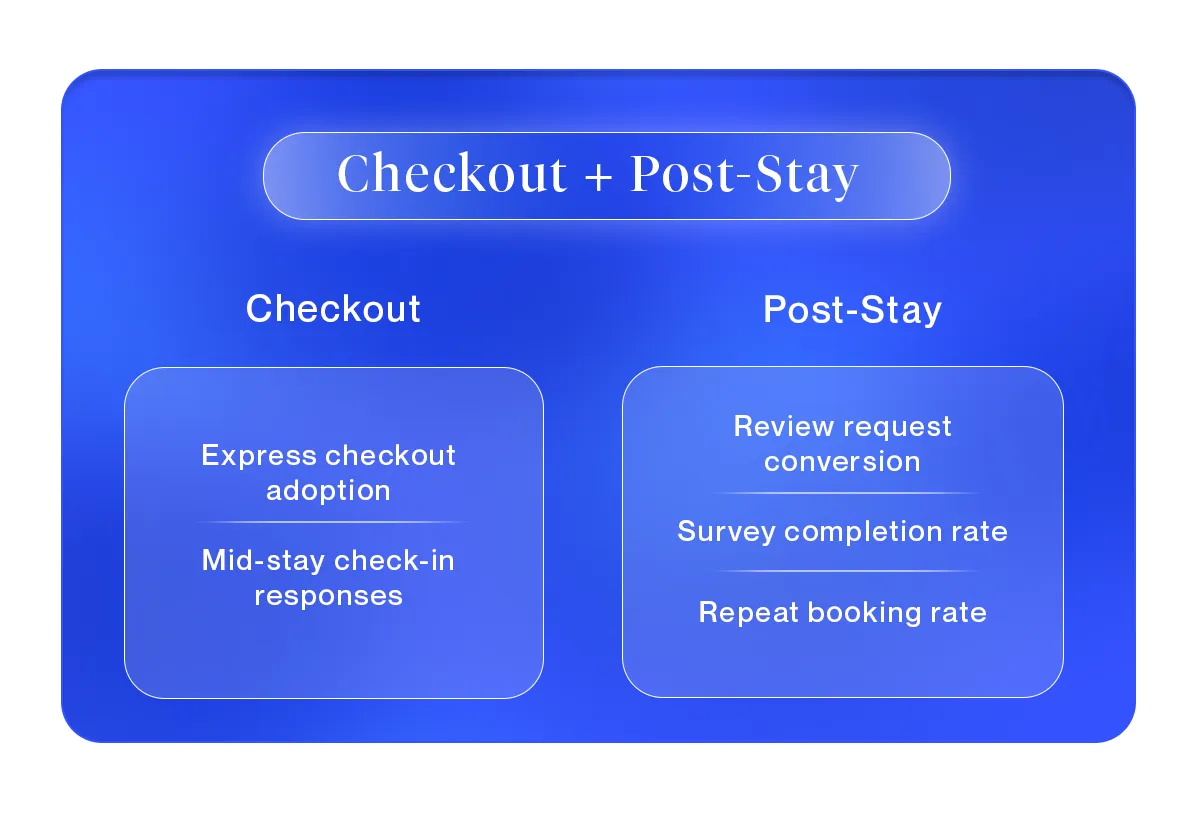
Checkout is a brief but high-stakes phase. The guest's final in-person impression is forming here. The KPIs in this phase measure how smooth the exit is and how effectively you capture satisfaction data before the guest leaves.
What it measures: The percentage of guests using digital or express checkout versus queuing at the front desk.
Why it matters: A long checkout queue on departure morning is one of the most common reasons a genuinely positive stay gets a 4-star review instead of 5. The last 15 minutes have a disproportionate impact on the final impression.
Benchmark to aim for: Properties that promote express checkout via in-stay messaging the night before departure report adoption rates of 30-50%. Properties that do not promote it report under 10%.
How to act on it:
What it measures: Whether guests are responding to your mid-stay check-in messages, and what their responses indicate about the current stay quality.
Why it matters: A mid-stay check-in message — something as simple as "How is everything going?" — gives you a real-time signal about service quality while there is still time to fix it. Guests who report a problem mid-stay and have it resolved are significantly more likely to leave a positive review than guests who report the same problem post-checkout.
Benchmark to aim for: Mid-stay check-in response rates via WhatsApp average 30-40%. Via SMS, 20-30%. Below 15% usually means the message is arriving at the wrong time (mealtimes, early morning) or feels too formal.
How to act on it:
Post-stay KPIs measure whether your engagement after checkout is converting experience into revenue. These metrics tie directly to the post-stay guest engagement strategy that bridges guest satisfaction to repeat bookings.
What it measures: The percentage of guests who received a review request and actually wrote a review.
Why it matters: This is the direct output of your post-stay communication quality. A high conversion rate means the timing was right, the channel was right, and the stay gave the guest something worth saying.
Benchmark to aim for: Review request conversion rates average 15-25% for well-timed, single-channel requests. Multi-channel campaigns (WhatsApp + email) can reach 30-35%.
How to act on it:
What it measures: The percentage of guests who complete your private post-stay feedback survey.
Why it matters: Survey data is your most actionable operational intelligence. It tells you what the reviews do not — the specific friction points, the service failures that were quietly endured rather than publicly posted, and the details that your team can actually fix.
Benchmark to aim for: Post-stay survey completion rates average 20-30%. Below 10% means the survey is too long, arriving too late, or being sent on a channel the guest has already disengaged from.
How to act on it:
What it measures: The percentage of guests who returned to book again within 12 months, specifically from the cohort that received your post-stay engagement sequence.
Why it matters: This is the metric that connects every other KPI in this framework to revenue. A high repeat booking rate tells you the entire guest journey is working — not just the post-stay phase.
Benchmark to aim for: Industry average repeat booking rates sit around 15-20% for leisure properties without structured post-stay engagement. Properties with active post-stay messaging programs report 25-35%.
How to act on it:
Beyond the phase-by-phase framework, there is a layer of messaging-specific KPIs that most hotels never track — and should.
These metrics live at the intersection of guest communication and operational performance. They are the leading indicators that predict how the experience metrics will look before the reviews come in.
Messages per stay Track how many messages your team sends and receives per guest stay. A rising number over time — without a corresponding improvement in satisfaction — suggests your automated FAQs and digital guidebooks are not doing their job. Guests are still messaging for information they should be finding on their own.
Channel consistency rate What percentage of guest conversations start and end on the same channel? Guests who begin on WhatsApp and get redirected to email mid-conversation report lower satisfaction. Track handoffs and minimize unnecessary channel switching.
Upsell message response rate by timing If you send the same upsell offer at different times — 5 days before arrival, 2 days before, and on arrival day — the response rates will vary significantly. Track by timing, not just by offer type. The insight is usually in the timing, not the offer itself.
Escalation rate What percentage of automated FAQ responses get escalated to a human team member? A high escalation rate on a specific topic tells you the automation is not answering that question well. A low escalation rate across the board tells you the automation is healthy.
Tracking these metrics is only useful if they are visible to the people who can act on them.
A practical guest journey KPI dashboard for a hotel team does not need to be complex. It needs to be reviewed regularly and connected to decisions.
Here is a simple structure that works:
Daily view (front desk and duty manager)
Weekly view (operations manager)
Monthly view (general manager)
The goal is not to track everything. It is to track the metrics that tell you something you can act on. Most hotels that fail at KPI tracking fail because they generate reports but do not build a process for responding to what those reports show.
A property can hit its RevPAR target and still be losing guests.
That happens when the revenue numbers look healthy but the experience metrics are quietly declining — review scores edging down, repeat booking rate flat, upsell revenue stagnant despite high occupancy.
Guest journey KPIs are early warning signals. They show you where the experience is breaking before the revenue impact becomes visible.
A drop in pre-arrival message open rate tells you guests are arriving less prepared — which predicts more front desk friction. A rise in average message response time tells you your team is overwhelmed — which predicts lower in-stay satisfaction scores. A falling upsell click-through rate tells you either the offer timing is wrong or the offer is not relevant — which predicts flat ancillary revenue.
These connections are not theoretical. AI-powered upsell systems achieve 31% conversion versus 12% for manual upsell approaches, and the difference is almost entirely in timing and relevance — exactly what journey-phase KPIs help you optimize.
The hotels that manage by these metrics are able to intervene early. They catch the problem in the pre-arrival phase before it becomes a front desk complaint. They see the upsell conversion drop in week one of a new campaign before they have run it for a month on a losing approach.
Managing the guest journey by KPIs means managing by cause rather than consequence.
Most hotel teams want to track these metrics. The barrier is not intent — it is having a system that surfaces them without requiring manual data collection across five different tools.
Guestara's analytics dashboard connects messaging activity, guest communication data, and journey automation into one view. You can see response times, upsell conversion rates, digital check-in adoption, and post-stay engagement metrics without pulling reports from separate systems.
When your hotel guest communication operates from a single platform, the KPIs emerge naturally from what your team is already doing. You are not creating extra work to track performance — you are making the work you are already doing visible.
If you want to see what guest journey metrics look like for a property using Guestara, book a demo with the team.
Guest journey KPIs are metrics that measure how guests experience a hotel at each stage of their stay — pre-booking, pre-arrival, in-stay, checkout, and post-stay. Unlike standard hotel metrics such as RevPAR or ADR, which measure financial outcomes, guest journey KPIs measure the communication, service, and experience inputs that drive those outcomes. Examples include booking confirmation open rate, message response time, digital check-in adoption rate, upsell conversion rate, FAQ deflection rate, and post-stay review request conversion rate. Hotels that track these metrics can identify experience problems before they appear in reviews or affect repeat booking rates.
For in-stay guest messages, the benchmark is under 5 minutes for urgent requests (maintenance, room issues) and under 15 minutes for general inquiries. Hotels managing guest communication across separate channels — WhatsApp, SMS, OTA inbox, email — often see average response times of 45-90 minutes. Centralizing all channels into a unified inbox typically brings this below the 10-minute mark. Response time is one of the strongest predictors of guest satisfaction scores — the correlation between faster responses and higher review ratings is well documented across hospitality research
Upsell performance in the guest journey should be tracked by three metrics: send rate (what percentage of guests received an upsell offer), click-through rate (how many engaged with it), and conversion rate (how many purchased). These should be tracked separately for each phase — pre-arrival, in-stay, and checkout — because conversion rates vary significantly by timing. Pre-arrival upsell offers (sent 48-72 hours before check-in) consistently outperform at-checkout offers. AI-powered upsell systems achieve conversion rates of around 31% compared to 12% for manual approaches, with the difference driven primarily by timing and personalization.
Reducing front desk calls requires identifying which calls are routine inquiries — WiFi password, pool hours, breakfast times, checkout time, parking instructions — and automating answers to those questions through FAQ chatbots, digital guidebooks, and WhatsApp auto-replies. Log your front desk calls by category for one week to find the top 10 question types. Then build an auto-reply or guidebook entry for each one, and include a link to the guidebook in every welcome message. Hotels using this approach consistently report 30-50% reductions in routine inquiry calls within 60 days, freeing staff for guest interactions that genuinely require human judgment.
FAQ deflection rate measures the percentage of routine guest questions answered automatically — through a chatbot, auto-reply, or digital guidebook — without requiring staff intervention. A well-configured FAQ automation setup should deflect 60-70% of routine inquiries. A deflection rate below 40% usually indicates that the automated content is outdated, the entry points (such as the welcome message or chatbot prompt) are not prominent enough, or the chatbot is not matching the guest's phrasing correctly. Reviewing deflection by question topic monthly reveals which content gaps need filling and which automation rules need adjustment.
We work closely with the industry leaders to offer seamless solutions


We’re here to help your whole team stay ahead of the curve as you grow.

Get up and running quickly with a personalized onboarding plan

Connect with real people who really get it, 24/7

Checkout our vast library of free resources, templates and more
There's only so much we can say — so let us show you! Schedule a demo today and reach your business goals.