The communication KPIs that predict guest satisfaction, review scores, and repeat bookings before they show up in RevPAR. A practical tracking guide for hotel GMs.
.webp)
Most hotel GMs know their RevPAR before breakfast. Ask them their average message response time, their OTA response rate, or their mid-stay survey completion rate, and the answer is usually a pause.
That gap matters more than it looks.
RevPAR tells you what already happened. Communication KPIs tell you what is about to happen to your review scores, your repeat booking rate, and your ability to hold rate. They are the leading indicators most GMs are not tracking: the numbers that signal problems weeks before those problems show up in revenue.
This blog covers the communication metrics that belong on every GM's dashboard, what each one is actually telling you, and the benchmarks to measure yourself against.
This distinction shapes how you use the metrics that follow, so it is worth being precise about it.
RevPAR, your TripAdvisor rating, your repeat guest ratio: all lagging indicators. By the time any of them move, the decisions that caused the movement happened weeks or months earlier. These numbers tell you where you have been.
Average message response time, OTA response rate, mid-stay satisfaction signals: these are leading indicators. They measure behaviors and conditions that predict where you are going. When they move, you still have a window to act.
Hotel communication KPIs are almost entirely leading indicators. A drop in WhatsApp response rate this week will show up in review scores in 3 to 6 weeks. A pattern of missed OTA messages will affect your Booking.com ranking in 4 to 8 weeks. The value of tracking them is exactly that: you see the problem while it is still fixable.
The complete guide to hotel guest communication and journey automation covers how these communication moments connect across the full guest lifecycle. What follows are the specific metrics worth pulling from that system every week.
How long it takes your team to send the first reply to an incoming guest message, from the moment the message arrives.
First response time is the single most predictive communication metric for guest satisfaction. A guest who received a reply within 5 minutes had a categorically different experience than one who waited 45 minutes, even if the content of the reply was identical. Speed signals that the hotel noticed them.
Total time between message received and first reply, averaged across all messages in a period. Most hotel messaging platforms surface this automatically. If yours does not, it cannot track this KPI.
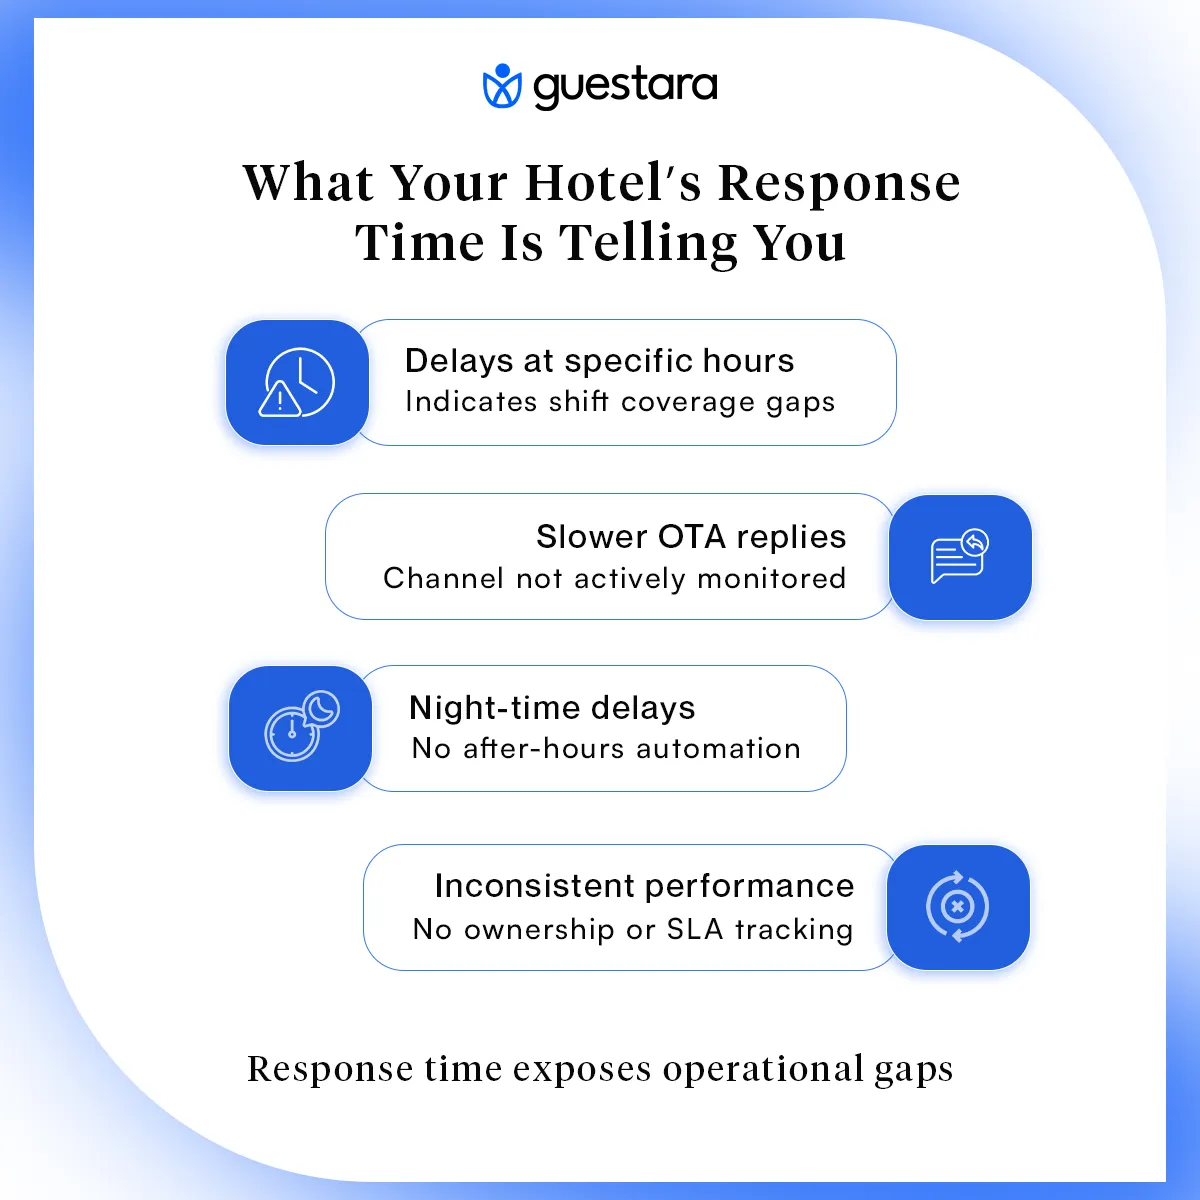
What a declining number tells you: Your team is understaffed during a specific window, or messages are arriving on a channel that nobody is watching. Pull response time by hour of day to find where the gap is. A spike at 2pm usually means a shift handoff problem. A spike between 10pm and 8am means after-hours automation is not configured.
What a good number looks like in practice: A 200-room independent hotel tracking this metric weekly should be averaging under 8 minutes for WhatsApp during operating hours. Hotels without a unified inbox typically average 45 to 90 minutes across all channels.
The percentage of messages received through OTA platforms (Booking.com, Expedia, Airbnb) that received a reply within 24 hours.
A guest whose pre-arrival question went unanswered arrives less prepared and more frustrated. That much is obvious. The less visible cost is what it does to your ranking: Booking.com uses response rate as a search visibility signal. A property sitting at 85% response rate ranks lower than a comparable property at 98%. Every missed OTA message is costing you future bookings, not just the current guest relationship.
(Messages replied within 24 hours / total messages received) x 100. Booking.com surfaces this directly in your extranet under "Inbox performance."
Above 95% is the standard for competitive properties. Booking.com's stated threshold to avoid penalties is 90% within 24 hours, but the competitive properties in most markets sit above 97%.
What a declining number tells you: OTA messages are not being routed into your main workflow. They are sitting in a separate extranet login that nobody checks consistently. The fix is connecting OTA inboxes to your unified messaging system so these messages arrive alongside WhatsApp and email in one view.
The number of incoming guest messages per channel per week, and how that volume is distributed.
Message volume by channel tells you where your guests actually want to communicate, which is not always where your team is investing attention. If 60% of your incoming messages are WhatsApp but you have no dedicated WhatsApp coverage during peak hours, that is a structural mismatch that will show up in response times and guest satisfaction.
Pull total message counts from each channel weekly. Any hotel messaging platform should surface this. If you are managing channels separately, you will need to aggregate manually.
A 100-room hotel at 75% occupancy should be receiving meaningful message volume daily across channels. If total weekly message volume is under 50 across all channels, something is suppressing guest communication.
Resolution rate is the percentage of guest messages that reached a satisfactory conclusion without the guest needing to follow up. Escalation rate is the percentage that required a manager or senior staff member to intervene.
A high resolution rate means guests are getting what they need at first contact. A high escalation rate means routine messages are reaching management — which points to undertrained front-line staff, unclear routing rules, or genuine request complexity. Tracking both tells you whether your first-line team is equipped, not just whether they are busy.
Resolution rate above 80% for in-stay requests is healthy. An escalation rate above 15% consistently suggests a training or routing issue rather than a volume issue.
If resolution rate is dropping, check whether templates are being used consistently and whether the team has access to the information guests are asking for. If escalation rate is rising, look at whether your routing rules are sending messages to the right first-line responder or whether everything is landing in a general inbox.
The percentage of in-stay guests who respond to a mid-stay check-in message, and what their responses indicate about current experience quality.
This is the only KPI on this list that catches a problem while the guest is still on property. A low satisfaction signal gives you a 12 to 48-hour window to intervene before the guest makes up their mind about the review they are going to write. Every other KPI here is measuring something that already happened. This one is measuring something you can still change.
(Guests who responded to mid-stay check-in / guests who received mid-stay check-in) x 100. Track satisfaction signal separately: out of respondents, what percentage indicated an issue or gave a low rating.
Response rates for mid-stay WhatsApp check-ins average 30 to 40%. Below 15% usually means the message is arriving at the wrong time of day or feels too formal. For satisfaction signals, any rate above 5% of total respondents flagging an issue warrants a review of what specific problems are surfacing.
A low response rate on the mid-stay check-in is not necessarily bad news for guest satisfaction. It often means guests are content and not motivated to respond. The valuable signal is the satisfaction rate among those who do respond. A rising proportion of low-satisfaction responses in week 3 of a month is a leading indicator of a review score dip in weeks 4 to 6. The hotel guest journey framework shows where mid-stay check-ins sit in the broader communication sequence and what they are designed to surface.
The percentage of guests who received a post-stay review request and wrote a review on Google, TripAdvisor, or another platform.
Sending the review request is the easy part. This KPI measures whether the timing was right, the channel was right, and the stay was strong enough that the guest felt motivated to act. A conversion rate below 10% is telling you something about one or all three of those conditions.
(Guests who left a review / guests who received review request) x 100. Track separately by channel: WhatsApp requests typically convert significantly higher than email.
WhatsApp review request conversion: 20 to 30%. Email review request conversion: 10 to 20%. Multi-channel sequences (WhatsApp plus email): up to 35%. Below 10% across all channels usually indicates timing is wrong, channel is wrong, or the stay experience itself is not prompting action.
If your conversion rate is strong but your review volume is not rising, check whether the review request is going to all guests or only a segment. If your conversion rate is dropping, check whether you have changed the timing of the send. The 20 to 28-hour post-checkout window consistently outperforms same-day sends and sends beyond 48 hours. The post-stay engagement strategy explains why the timing window matters and how to structure the full post-stay sequence around it.
The percentage of incoming guest messages answered automatically through chatbot, auto-reply, or digital guidebook without requiring staff intervention.
Every message your automation handles correctly is one fewer message your team responds to manually. That frees capacity for conversations that actually need judgment, and it means guests get instant answers at 2am just as reliably as at 2pm.
(Messages resolved automatically / total incoming messages) x 100.
50 to 70% for hotels with well-configured FAQ automation. Below 30% means your automation is either not configured for the right questions or the guidebook content is outdated. Above 80% may indicate your automation is intercepting messages that deserve a human response.
Pull your deflection rate by question type monthly. The questions your automation fails to deflect are your content gaps. If "what time is checkout" keeps routing to a human because the auto-reply is not triggering, the configuration needs updating. If "can I get an early check-in" keeps deflecting when it should route to a human for approval, the routing rule is too broad. Hotels that implemented text messaging with strong FAQ automation reduced front desk phone traffic by up to 40%, because guests who get instant answers digitally stop calling to ask the same questions.
The percentage of direct bookings that came through communication channels such as WhatsApp, website chat, or Instagram DM rather than through the booking engine directly.
Most hotels think of their messaging channels as service tools. This KPI reveals their revenue function. A guest who DMs a question on Instagram and books directly through that conversation is a direct booking that came from communication quality, not from your pricing or SEO. Hotels tracking this know exactly what WhatsApp is worth as a revenue channel, not just a support one.
Tag or track bookings that originated from a guest communication thread. Most hotels do not track this at all, which means the revenue contribution of communication channels is invisible in their reporting. Any hotel messaging platform with booking integration should be able to surface this.
Hotels actively tracking and optimizing WhatsApp and chat as booking channels report 4 to 8% of direct bookings originating from communication threads. The role of guest communication in shaping the hotel guest journey shows how pre-booking communication quality directly influences this conversion.
Most GMs do not need a sophisticated analytics platform to track these KPIs. They need a consistent format, a weekly cadence, and one person accountable for updating the numbers.
A practical dashboard structure:
Pick a cadence and stick to it. When a number slips, you want to know before it shows up in your revenue report.
The hotel guest journey KPIs guide covers how these communication metrics connect to the broader set of experience KPIs that predict repeat bookings and guest lifetime value.
Resolution rate, FAQ deflection rate, and communication-attributed direct bookings: these three are almost never tracked by independent hotels, because surfacing them requires a system that connects messaging, routing, and bookings in one place.
Most hotels that track communication performance at all stop at average response time and OTA response rate. Those two numbers tell you whether messages are being answered. They say nothing about whether they are being answered by the right person, whether automation is absorbing the routine volume, or whether communication is generating revenue.
The hotels tracking the full set can have a specific conversation: the Monday afternoon dip in response time is a staffing gap, not a motivation problem. The drop in review request conversion is a timing issue, not a stay quality issue. The 6% of direct bookings that came from WhatsApp conversations before the guest ever visited the website — that is the number that changes how you think about the channel.
Guestara surfaces all of these KPIs from a single platform. If you are currently pulling numbers from five different tools or not pulling them at all, see what a consolidated communication dashboard looks like for your property.


The communication KPIs that predict guest satisfaction, review scores, and repeat bookings before they show up in RevPAR. A practical tracking guide for hotel GMs.
Most hotel GMs know their RevPAR before breakfast. Ask them their average message response time, their OTA response rate, or their mid-stay survey completion rate, and the answer is usually a pause.
That gap matters more than it looks.
RevPAR tells you what already happened. Communication KPIs tell you what is about to happen to your review scores, your repeat booking rate, and your ability to hold rate. They are the leading indicators most GMs are not tracking: the numbers that signal problems weeks before those problems show up in revenue.
This blog covers the communication metrics that belong on every GM's dashboard, what each one is actually telling you, and the benchmarks to measure yourself against.
This distinction shapes how you use the metrics that follow, so it is worth being precise about it.
RevPAR, your TripAdvisor rating, your repeat guest ratio: all lagging indicators. By the time any of them move, the decisions that caused the movement happened weeks or months earlier. These numbers tell you where you have been.
Average message response time, OTA response rate, mid-stay satisfaction signals: these are leading indicators. They measure behaviors and conditions that predict where you are going. When they move, you still have a window to act.
Hotel communication KPIs are almost entirely leading indicators. A drop in WhatsApp response rate this week will show up in review scores in 3 to 6 weeks. A pattern of missed OTA messages will affect your Booking.com ranking in 4 to 8 weeks. The value of tracking them is exactly that: you see the problem while it is still fixable.
The complete guide to hotel guest communication and journey automation covers how these communication moments connect across the full guest lifecycle. What follows are the specific metrics worth pulling from that system every week.
How long it takes your team to send the first reply to an incoming guest message, from the moment the message arrives.
First response time is the single most predictive communication metric for guest satisfaction. A guest who received a reply within 5 minutes had a categorically different experience than one who waited 45 minutes, even if the content of the reply was identical. Speed signals that the hotel noticed them.
Total time between message received and first reply, averaged across all messages in a period. Most hotel messaging platforms surface this automatically. If yours does not, it cannot track this KPI.
What a declining number tells you: Your team is understaffed during a specific window, or messages are arriving on a channel that nobody is watching. Pull response time by hour of day to find where the gap is. A spike at 2pm usually means a shift handoff problem. A spike between 10pm and 8am means after-hours automation is not configured.
What a good number looks like in practice: A 200-room independent hotel tracking this metric weekly should be averaging under 8 minutes for WhatsApp during operating hours. Hotels without a unified inbox typically average 45 to 90 minutes across all channels.
The percentage of messages received through OTA platforms (Booking.com, Expedia, Airbnb) that received a reply within 24 hours.
A guest whose pre-arrival question went unanswered arrives less prepared and more frustrated. That much is obvious. The less visible cost is what it does to your ranking: Booking.com uses response rate as a search visibility signal. A property sitting at 85% response rate ranks lower than a comparable property at 98%. Every missed OTA message is costing you future bookings, not just the current guest relationship.
(Messages replied within 24 hours / total messages received) x 100. Booking.com surfaces this directly in your extranet under "Inbox performance."
Above 95% is the standard for competitive properties. Booking.com's stated threshold to avoid penalties is 90% within 24 hours, but the competitive properties in most markets sit above 97%.
What a declining number tells you: OTA messages are not being routed into your main workflow. They are sitting in a separate extranet login that nobody checks consistently. The fix is connecting OTA inboxes to your unified messaging system so these messages arrive alongside WhatsApp and email in one view.
The number of incoming guest messages per channel per week, and how that volume is distributed.
Message volume by channel tells you where your guests actually want to communicate, which is not always where your team is investing attention. If 60% of your incoming messages are WhatsApp but you have no dedicated WhatsApp coverage during peak hours, that is a structural mismatch that will show up in response times and guest satisfaction.
Pull total message counts from each channel weekly. Any hotel messaging platform should surface this. If you are managing channels separately, you will need to aggregate manually.
A 100-room hotel at 75% occupancy should be receiving meaningful message volume daily across channels. If total weekly message volume is under 50 across all channels, something is suppressing guest communication.
Resolution rate is the percentage of guest messages that reached a satisfactory conclusion without the guest needing to follow up. Escalation rate is the percentage that required a manager or senior staff member to intervene.
A high resolution rate means guests are getting what they need at first contact. A high escalation rate means routine messages are reaching management — which points to undertrained front-line staff, unclear routing rules, or genuine request complexity. Tracking both tells you whether your first-line team is equipped, not just whether they are busy.
Resolution rate above 80% for in-stay requests is healthy. An escalation rate above 15% consistently suggests a training or routing issue rather than a volume issue.
If resolution rate is dropping, check whether templates are being used consistently and whether the team has access to the information guests are asking for. If escalation rate is rising, look at whether your routing rules are sending messages to the right first-line responder or whether everything is landing in a general inbox.
The percentage of in-stay guests who respond to a mid-stay check-in message, and what their responses indicate about current experience quality.
This is the only KPI on this list that catches a problem while the guest is still on property. A low satisfaction signal gives you a 12 to 48-hour window to intervene before the guest makes up their mind about the review they are going to write. Every other KPI here is measuring something that already happened. This one is measuring something you can still change.
(Guests who responded to mid-stay check-in / guests who received mid-stay check-in) x 100. Track satisfaction signal separately: out of respondents, what percentage indicated an issue or gave a low rating.
Response rates for mid-stay WhatsApp check-ins average 30 to 40%. Below 15% usually means the message is arriving at the wrong time of day or feels too formal. For satisfaction signals, any rate above 5% of total respondents flagging an issue warrants a review of what specific problems are surfacing.
A low response rate on the mid-stay check-in is not necessarily bad news for guest satisfaction. It often means guests are content and not motivated to respond. The valuable signal is the satisfaction rate among those who do respond. A rising proportion of low-satisfaction responses in week 3 of a month is a leading indicator of a review score dip in weeks 4 to 6. The hotel guest journey framework shows where mid-stay check-ins sit in the broader communication sequence and what they are designed to surface.
The percentage of guests who received a post-stay review request and wrote a review on Google, TripAdvisor, or another platform.
Sending the review request is the easy part. This KPI measures whether the timing was right, the channel was right, and the stay was strong enough that the guest felt motivated to act. A conversion rate below 10% is telling you something about one or all three of those conditions.
(Guests who left a review / guests who received review request) x 100. Track separately by channel: WhatsApp requests typically convert significantly higher than email.
WhatsApp review request conversion: 20 to 30%. Email review request conversion: 10 to 20%. Multi-channel sequences (WhatsApp plus email): up to 35%. Below 10% across all channels usually indicates timing is wrong, channel is wrong, or the stay experience itself is not prompting action.
If your conversion rate is strong but your review volume is not rising, check whether the review request is going to all guests or only a segment. If your conversion rate is dropping, check whether you have changed the timing of the send. The 20 to 28-hour post-checkout window consistently outperforms same-day sends and sends beyond 48 hours. The post-stay engagement strategy explains why the timing window matters and how to structure the full post-stay sequence around it.
The percentage of incoming guest messages answered automatically through chatbot, auto-reply, or digital guidebook without requiring staff intervention.
Every message your automation handles correctly is one fewer message your team responds to manually. That frees capacity for conversations that actually need judgment, and it means guests get instant answers at 2am just as reliably as at 2pm.
(Messages resolved automatically / total incoming messages) x 100.
50 to 70% for hotels with well-configured FAQ automation. Below 30% means your automation is either not configured for the right questions or the guidebook content is outdated. Above 80% may indicate your automation is intercepting messages that deserve a human response.
Pull your deflection rate by question type monthly. The questions your automation fails to deflect are your content gaps. If "what time is checkout" keeps routing to a human because the auto-reply is not triggering, the configuration needs updating. If "can I get an early check-in" keeps deflecting when it should route to a human for approval, the routing rule is too broad. Hotels that implemented text messaging with strong FAQ automation reduced front desk phone traffic by up to 40%, because guests who get instant answers digitally stop calling to ask the same questions.
The percentage of direct bookings that came through communication channels such as WhatsApp, website chat, or Instagram DM rather than through the booking engine directly.
Most hotels think of their messaging channels as service tools. This KPI reveals their revenue function. A guest who DMs a question on Instagram and books directly through that conversation is a direct booking that came from communication quality, not from your pricing or SEO. Hotels tracking this know exactly what WhatsApp is worth as a revenue channel, not just a support one.
Tag or track bookings that originated from a guest communication thread. Most hotels do not track this at all, which means the revenue contribution of communication channels is invisible in their reporting. Any hotel messaging platform with booking integration should be able to surface this.
Hotels actively tracking and optimizing WhatsApp and chat as booking channels report 4 to 8% of direct bookings originating from communication threads. The role of guest communication in shaping the hotel guest journey shows how pre-booking communication quality directly influences this conversion.
Most GMs do not need a sophisticated analytics platform to track these KPIs. They need a consistent format, a weekly cadence, and one person accountable for updating the numbers.
A practical dashboard structure:
Pick a cadence and stick to it. When a number slips, you want to know before it shows up in your revenue report.
The hotel guest journey KPIs guide covers how these communication metrics connect to the broader set of experience KPIs that predict repeat bookings and guest lifetime value.
Resolution rate, FAQ deflection rate, and communication-attributed direct bookings: these three are almost never tracked by independent hotels, because surfacing them requires a system that connects messaging, routing, and bookings in one place.
Most hotels that track communication performance at all stop at average response time and OTA response rate. Those two numbers tell you whether messages are being answered. They say nothing about whether they are being answered by the right person, whether automation is absorbing the routine volume, or whether communication is generating revenue.
The hotels tracking the full set can have a specific conversation: the Monday afternoon dip in response time is a staffing gap, not a motivation problem. The drop in review request conversion is a timing issue, not a stay quality issue. The 6% of direct bookings that came from WhatsApp conversations before the guest ever visited the website — that is the number that changes how you think about the channel.
Guestara surfaces all of these KPIs from a single platform. If you are currently pulling numbers from five different tools or not pulling them at all, see what a consolidated communication dashboard looks like for your property.
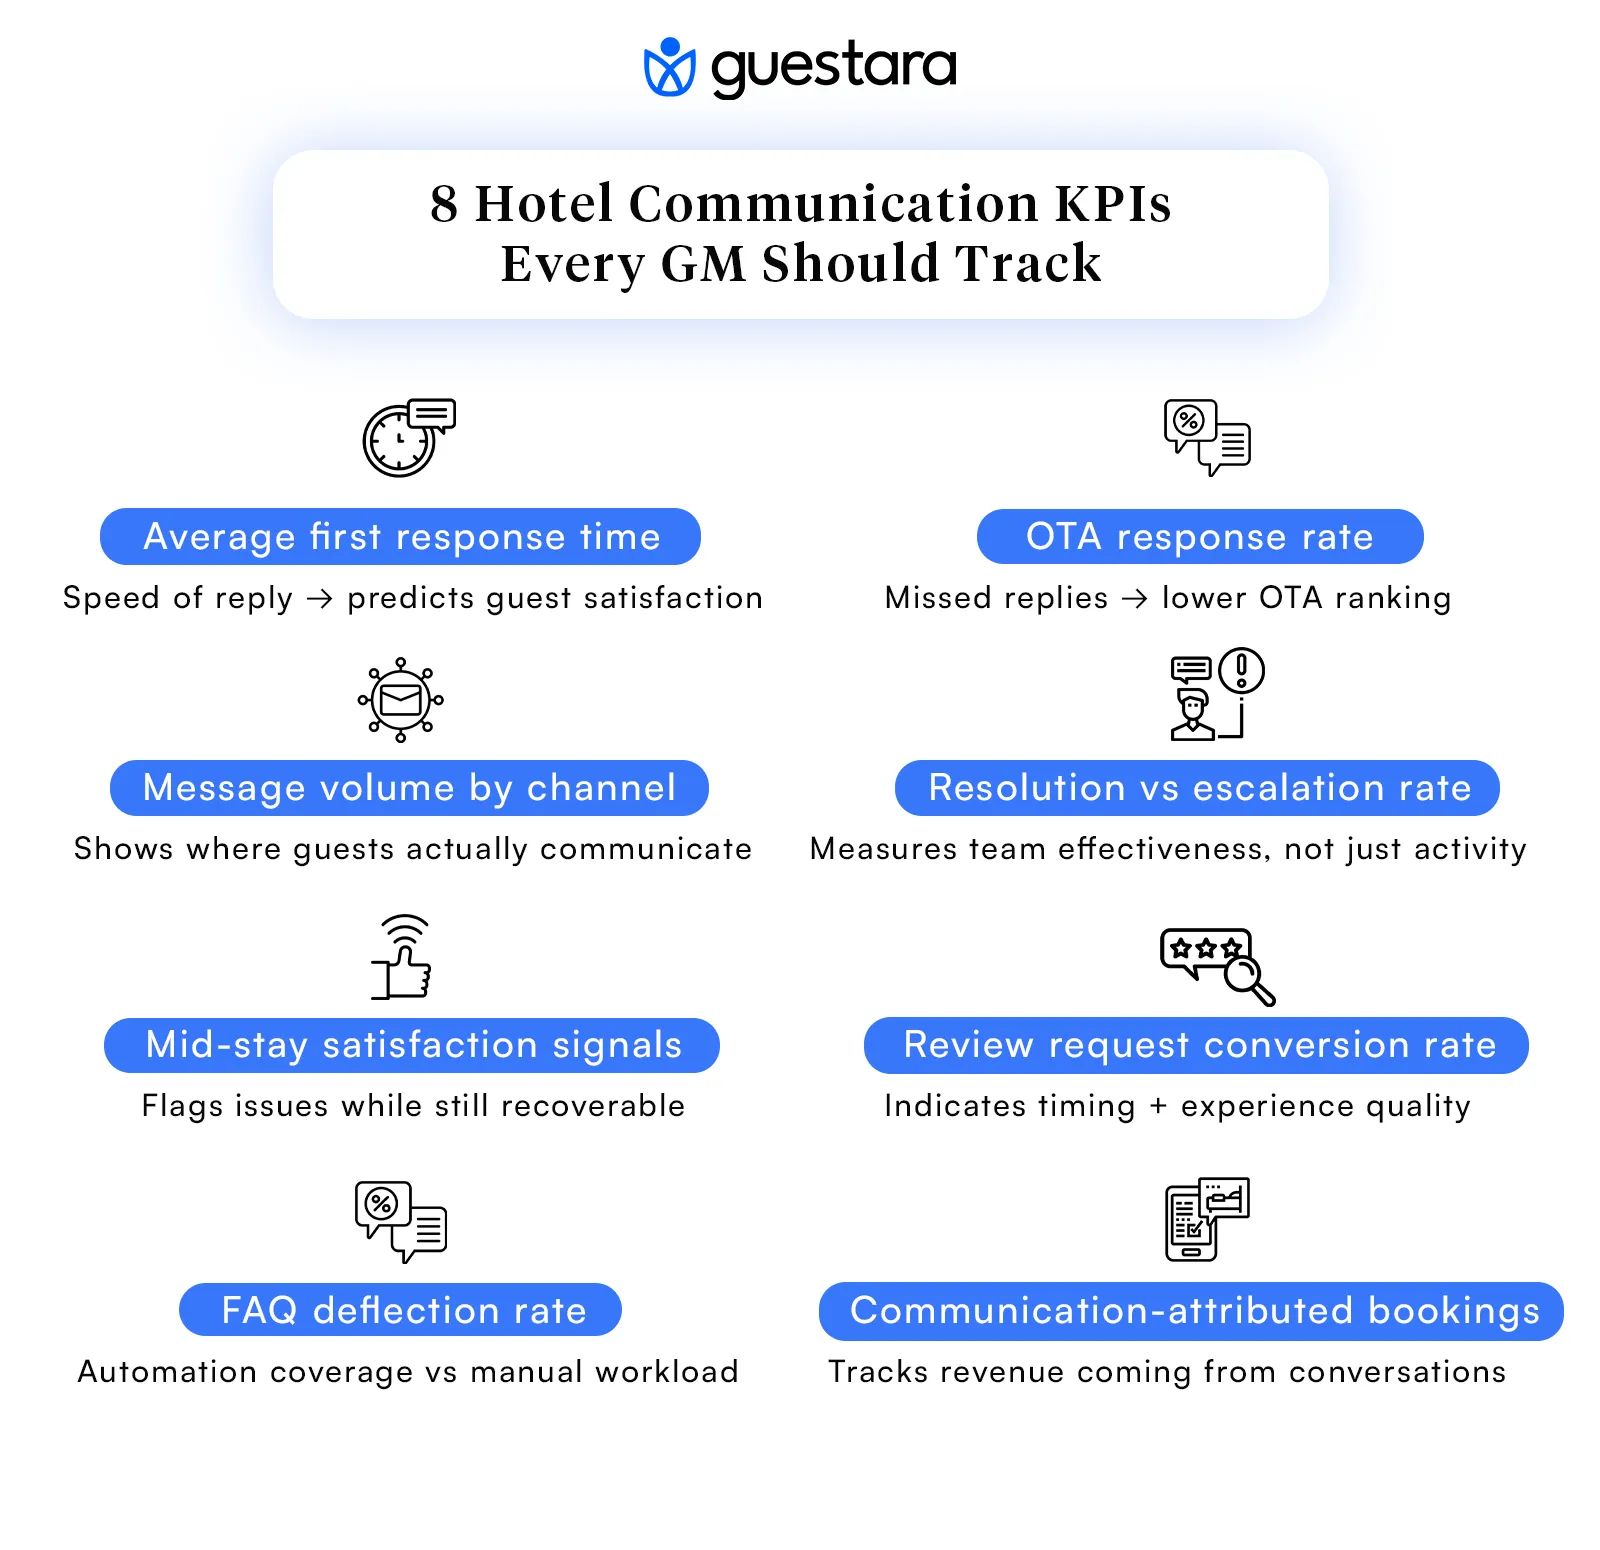
The eight most important are: average first response time, OTA response rate, message volume by channel, resolution and escalation rate, mid-stay satisfaction signal rate, post-stay review request conversion rate, FAQ deflection rate, and communication-attributed direct booking rate. Together they give a complete picture of whether your communication system is performing before problems show up in review scores or revenue.
Under 5 minutes for urgent in-stay WhatsApp messages, under 10 minutes for standard in-stay requests, under 30 to 60 minutes for OTA inbox messages, and under 2 hours for email pre-booking inquiries. Hotels without a unified inbox typically average 45 to 90 minutes across channels regardless of intent.
FAQ deflection rate is the percentage of incoming guest messages resolved automatically without staff intervention. Hotels with well-configured automation should deflect 50 to 70% of routine inquiries. Below 30% means the automation is not configured for the right questions. Reviewing which questions are not deflecting monthly reveals the specific content gaps to fix.
Booking.com and Expedia track response rate as a visibility factor. A property with a 95% or higher response rate within 24 hours will generally rank above a comparable property at 85%. The practical impact is that missed OTA messages reduce future inbound bookings from those platforms, compounding the cost of the original missed message beyond just the individual guest interaction.
It is the percentage of in-stay guests who respond to a mid-stay check-in message and indicate a service issue or low satisfaction. It is the only communication KPI that captures recoverable problems while the guest is still on property. A rising signal rate in a given week is a leading indicator of review score decline in the following 3 to 6 weeks.
We work closely with the industry leaders to offer seamless solutions


We’re here to help your whole team stay ahead of the curve as you grow.

Get up and running quickly with a personalized onboarding plan

Connect with real people who really get it, 24/7

Checkout our vast library of free resources, templates and more
There's only so much we can say — so let us show you! Schedule a demo today and reach your business goals.